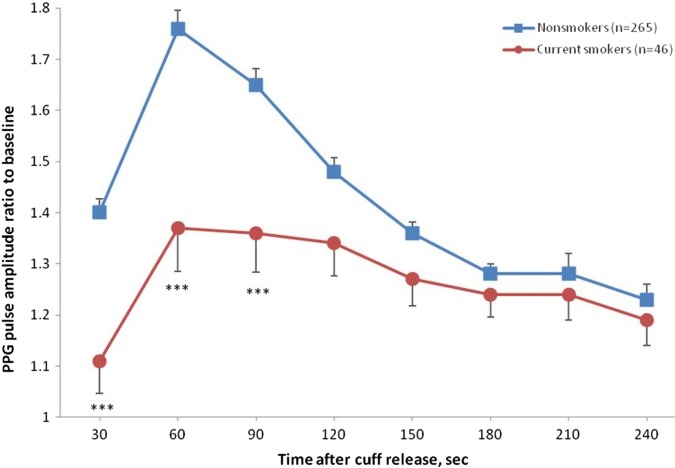
Figure 3.
Photoplethysmography (PPG) ratio of pulse amplitude for each 30 s time interval after cuff deflation to the baseline pulse amplitude divided by the corresponding ratio in the control finger in smokers and non-smokers participants. Smokers had significantly lower response throughout the 0–120 s postdeflation intervals. Symbols are means and SE. Models are adjusted for sex, age, body mass index, total cholesterol and blood glucose. ***p<0.001 versus non-smokers.

