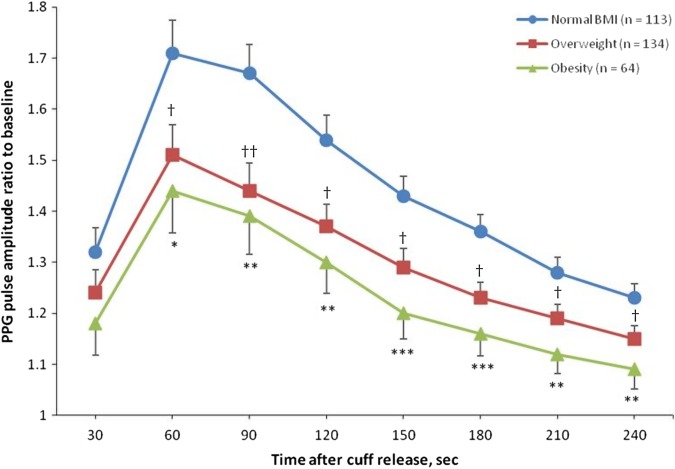
Figure 4.
Photoplethysmography (PPG) ratio of pulse amplitude for each 30 s time interval after cuff deflation to the baseline pulse amplitude divided by the corresponding ratio in the control finger in participants with normal body mass index (BMI), overweight (25 kg/m2≤BMI<30 kg/m2) and obesity (BMI≥30 kg/m2). Symbols are means and SE. Models are adjusted for sex, age, smoking, total cholesterol and blood glucose. *p<0.05, **p<0.01, ***p<0.001 versus lean participants. †p<0.05, ††p<0.01, versus lean participants.

