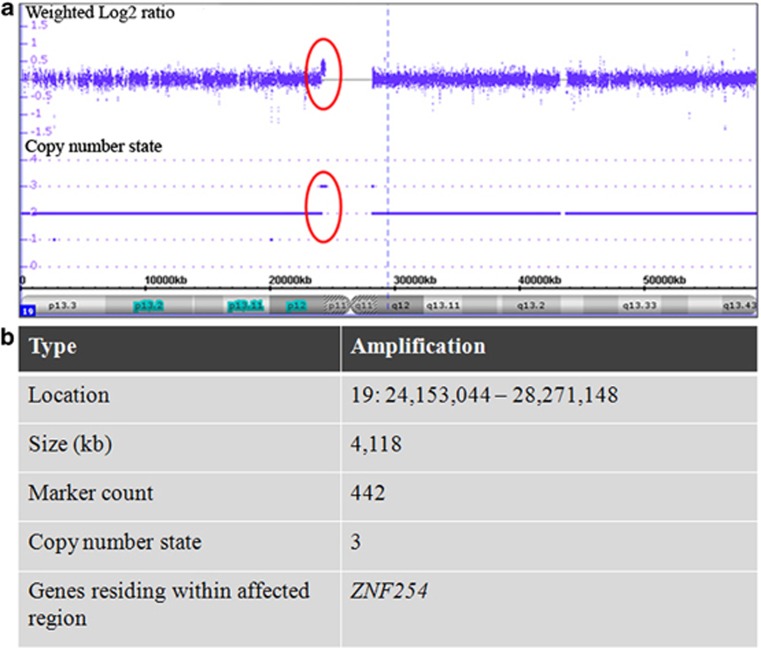
Figure 4.
Copy number change in chromosome 19 in CLEC oligoclone 10. (a) Copy number profile of chromosome 19 of CLEC oligoclone 10 with transgene integration at chromosome 8p22 generated on Affymetrix Cytoscan HD Array Set. Weighted log2 signal intensity ratios and copy number state across chromosome 19 are depicted on the vertical axis, and cytobands and distance from the start of the chromosome on the horizontal axis. A single locus with significant amplification (identified by at least 50 consecutive probes showing concordant change) is circled. (b) Characteristics of the significantly amplified genomic region. The genomic location, physical size, number of probes and copy number state across the affected region in chromosome 19 as well as the single gene residing within this region are tabulated.

