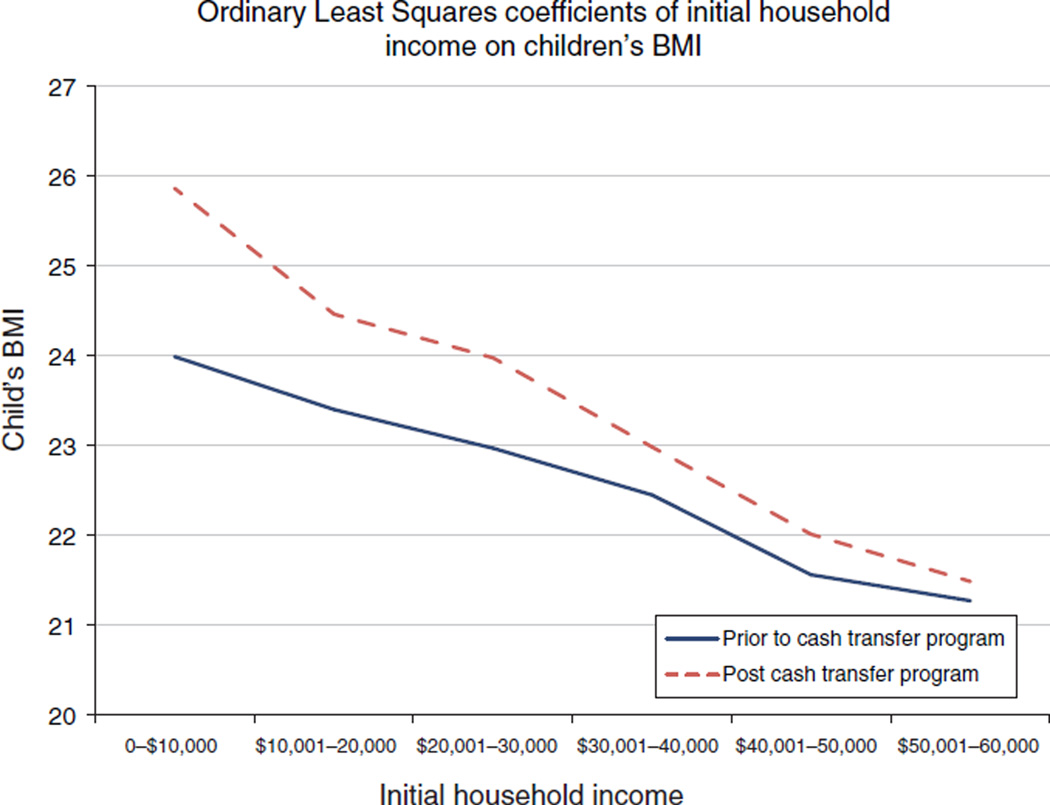
Figure 1. Conditional Means Plot of BMI as a Function of Income Before and After the Casino Transfers.
Notes: Ordinary Least Squares regressions of children’s BMI on dummies indicating six different initial (pre-casino) household income categories before and after the casino transfers. The highest income category (over $60,000 in annual income) is the reference category.

