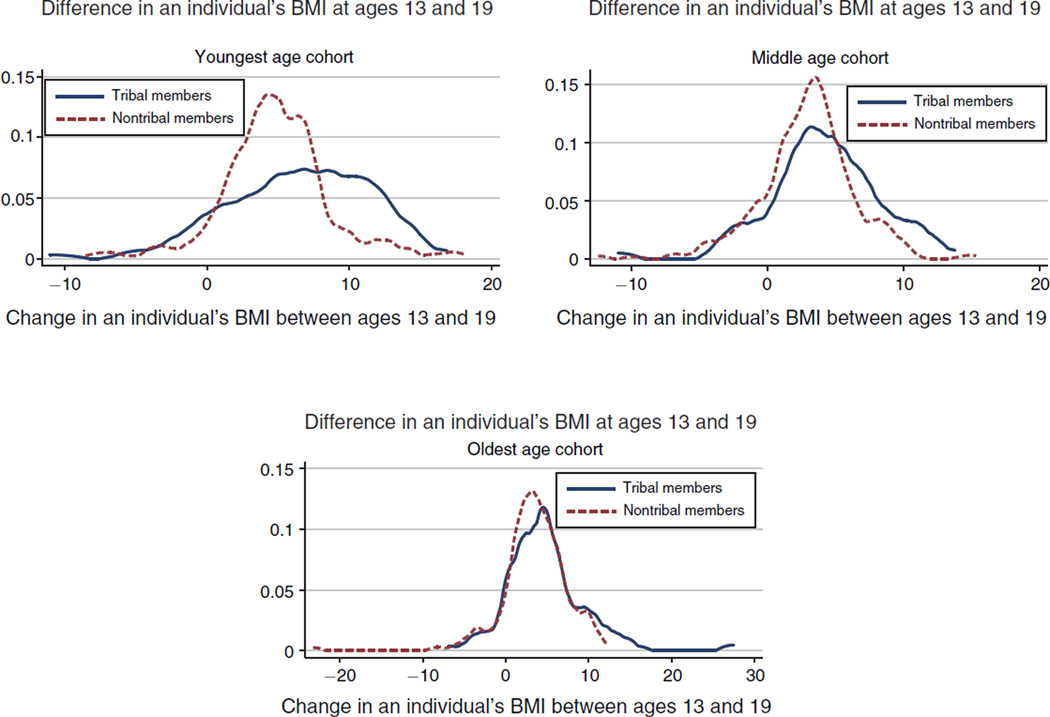
Figure 3. Distribution of Individual Changes in BMI by Cohort between Ages 13 and 19 among Tribal Members and Nonmembers.
Notes: The plots show the distribution of changes in children’s BMI between ages 13 and 19 by cohort and by tribal affiliation. The youngest cohort was aged 13 when the transfers started, the middle cohort was 15, and the oldest cohort was 17. The solid line shows the distribution of BMI changes among tribal members. The dashed line shows the distribution of changes in BMI for nonmembers.

