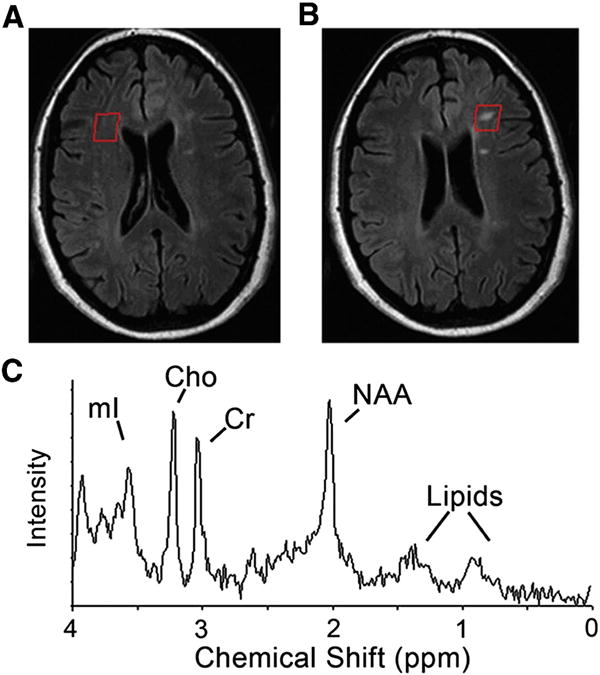
Fig. 1.

MRI and MR spectroscopy (MRS) of relapsing–remitting multiple sclerosis (RRMS) subject showing (A) normal appearing white matter and (B) non-enhancing lesion. The representative T1 weighted MRIs (upper) demonstrate the voxel placement for MRS indicated by the red square. (C) Representative MR spectra, indicating major metabolites: mI–myo-inositol; Cho–choline containing compound; Cr–creatine; NAA–N-acetyl as-partate, and lipids. Control white matter spectra were acquired from similar locations.
