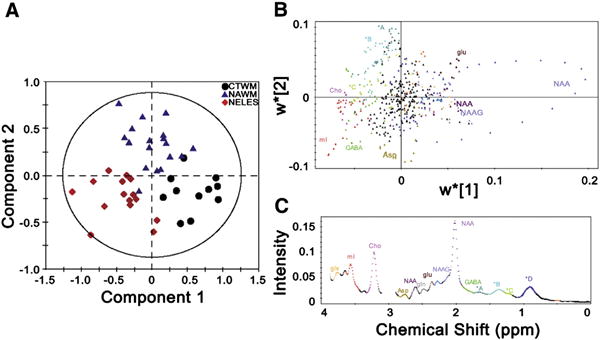
Fig. 2.

Comprehensive metabolomic model using PLS-DA distinguishes between control white matter (CTWM), normal appearing white matter (NAWM), and non-enhancing lesions (NELES) based on their metabolic profiles. (A) On the PLS-DA score plot, each single spectrum is converted to a data point that represents the relative contribution of metabolites from MRS of CTWM (black circle), NAWM (blue triangle), and NELES (red diamond) from the frontal lobe. A 2-dimensional loading plot (top panel) (B) colored by spectral features (bottom panel) (C) demonstrates the contribution each point along the spectrum makes to the component analysis in A. This aids in interpretation when there are a lot of variables, as in the case of full resolution MRS datasets. While the NAA peak did not show up in the 1-dimensional loading projection, it can be clearly seen to be the most pronounced in the CTWM. The creatine peaks (3.0 and 3.9 ppm) were left out of analysis since the spectra were normalized to creatine. Key: glx: glutamine + glutamate; mI: myo-inositol; Cho: choline; Asp: aspartate; NAA: N-acetyl aspartate; gln: glutamine; glu: glutamate; NAAG: N-acetyl aspartyl glutamate; GABA: γ-aminobutyric acid. *A: 1.65−1.75 ppm, macromolecules; *B 1.3−1.65 ppm, lipids, alanine, and lactate; *C 1.15−1.3 ppm, macromolecules, possibly lactate; *D 0.8−1.1 ppm, lipids. Metabolite assignments are based on reported chemical shifts in the in vivo MRS literature (Govindaraju et al., 2000).
