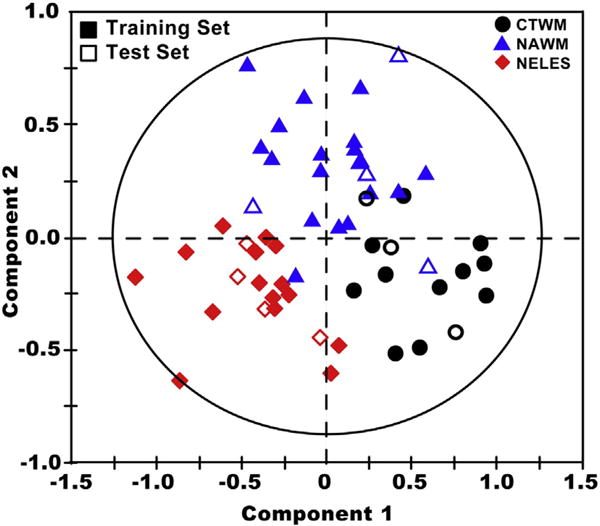
Fig. 3.

Validation of the PLS-DA model. Using the model described in Fig. 2 (training set), a second set of data (test set) was used to test the validity of the model (training set–filled symbols; test set–open symbols). The close clustering of the test set to the training set demonstrates the validity of the model described in Fig. 2 for separating out tissue types based on their metabolic properties.
