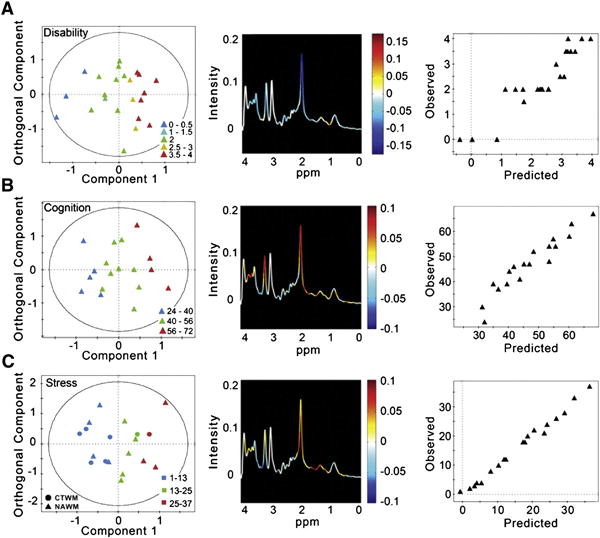
Fig. 4.

The correlation of clinical features in RRMS and metabolic profiles. A separate O-PLS model was developed for each of the following characteristics commonly seen in RRMS: global neurological impairment measured by EDSS; verbal memory measured by RAVLT; and stress measured by SRRS. (A) The first component of the score plot (left) demonstrates how the metabolic profiles for each NAWM spectrum, represented by a single point, vary with neurological impairment (EDSS, where 0 is no impairment and 4 is moderate impairment). The orthogonal component represents the variability in the dataset unrelated to neurological impairment. The spectrum (center) is color-coded by the regression coefficients driving the O-PLS model, thus summarizing the metabolites varying with neurological impairment. For example, NAA is colored blue, indicating that as NAA decreases EDSS increases. The observed versus predicted plot (right) from the internal cross validation indicates a good model with an R2 of 0.858 and RMSE of 0.466. (B) The first component of the scores plot (left) demonstrates how the metabolic profiles of NAWM vary with verbal memory measured by RAVLT, where a lower score indicates declining verbal memory. The spectrum (center) is color-coded by the O-PLS model coefficients, where red indicates metabolites increasing with increasing verbal memory (or, conversely, decreasing with memory decline), and blue metabolites are decreased with increasing memory performance. The observed vs. predicted plot (right) has an R2 of 0.909 with a RMSE of 3.55, indicating a predictive model. (C) The first component of the score plot (left) demonstrates how the metabolic profiles of CTWM and NAWM vary with stress measured by SRRS, where a higher score indicates a greater amount of stressful life events. The spectrum (center) is color-coded by the O-PLS model coefficients, where metabolites colored red are increasingand those colored blue are decreasing with increased stress. The observed vs. predicted plot (right) has an R2 of 0.991 and RMSE of 1.07, indicating a predictive model.
