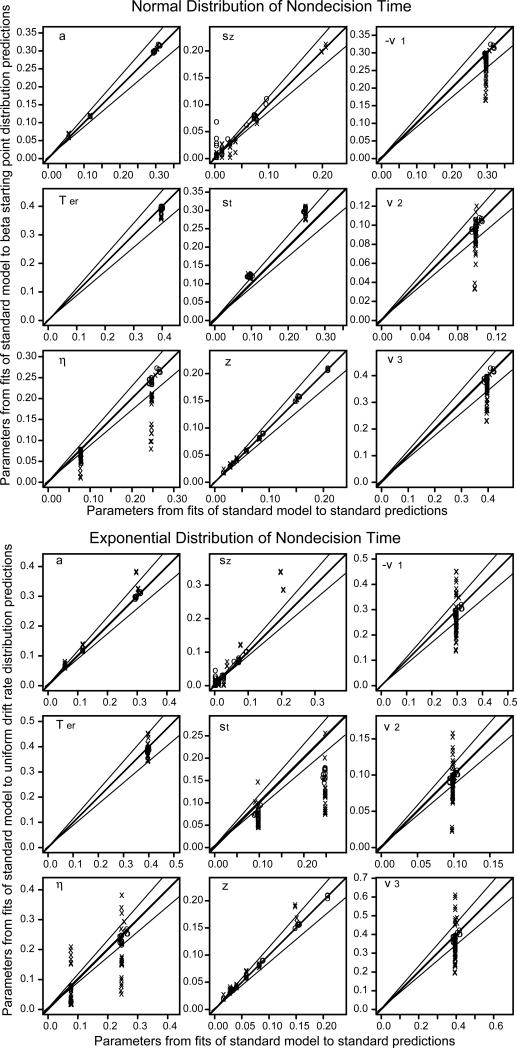
Figure 5.
The same plots as in Figure 3 but with normally-distributed nondecision time in the top half and exponentially-distributed nondecision time in the bottom half. For the normally-distributed nondecision time conditions, the x's are for boundary separation a=0.06. For the exponentially-distributed nondecision time conditions, the italicized parameter values in Table 1 are represented by x's (these have biased estimates of drift rates) and the non-italicized parameter values in Table 1 are represented by o's (see the text for discussion).

