Figure 4.

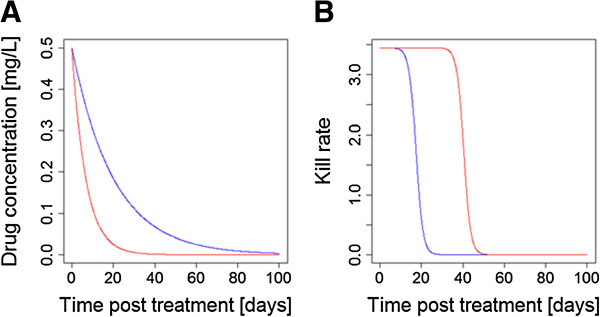
How natural variation in PK/PD may undermine matched post-treatment drug activity profiles. The two drugs have, on average, the same PK/PD parameters so are perfectly matched on average, c.f. Figure 3C. In these examples, natural variation around these mean PK/PD values results in one drug in the CT being exposed as a monotherapy for a significant period post-treatment. These illustrative differences reflect variation in single parameters: mismatches may become much larger once simultaneously variation in all PK/PD parameters is included. (A) An example of the impacts of differences in human PK, elimination rate; the red drug is eliminated by this patient 50% faster than the average while the blue drug is eliminated 50% slower than the average. (B) How variation in parasites PD parameters affect these profiles: the patient has the same PK for each drug (so concentration profiles post-treatment for both drugs are identical) but the parasites inoculated into the patient differ in their sensitivity to the drugs: their 10-fold higher resistance (IC50) to the blue drug means the red one is effectively a monotherapy for a significant period of time post-treatment. [Figure 4 was constructed using simple PK/PD models and their corresponding equations [22,25]. Parameter values for the two drugs are as follows: Dose is 75 mg/kg; volume of distribution is 150 L/kg; elimination rate per day is 0.05 for ‘blue’ and 0.15 for ‘red’ (equivalent to half-lives of 13.8 and 4.6 days, respectively); maximal drug-killing rate per day (Vmax) is 3.45; IC50 is 0.088 mg/L for ‘blue’ and 0.0088 mg/L for ‘red’; slope of dose-response curve (n) is 6].
