
Figure 5.
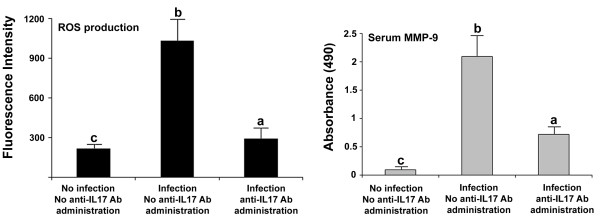
ROS production and serum MMP-9 levels measured by fluorometry and ELISA, respectively. Samples were taken at 6 dpi. Each bar represents the mean ± SD value from three independent experiments. Within each graph, bars with different letters are significantly different (P < 0.05) according to Duncan’s multiple-range test.