
Figure 1.
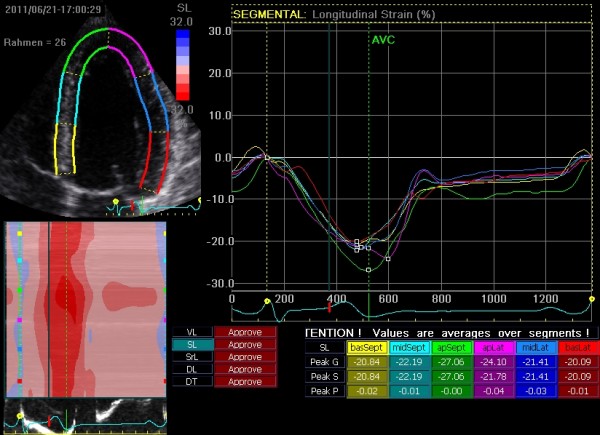
2D-Strain analysis of the left ventricle in the apical two chamber view with average values for peak systolic strain (Peak S) peak global strain (Peak G) and peak positive strain (Peak P) over each segment.
Official websites use .gov
A
.gov website belongs to an official
government organization in the United States.
Secure .gov websites use HTTPS
A lock (
) or https:// means you've safely
connected to the .gov website. Share sensitive
information only on official, secure websites.
2D-Strain analysis of the left ventricle in the apical two chamber view with average values for peak systolic strain (Peak S) peak global strain (Peak G) and peak positive strain (Peak P) over each segment.