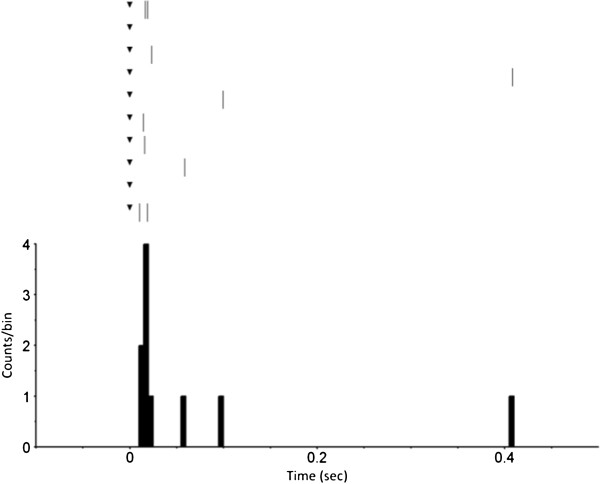
Figure 11.

Perievent raster with histogram of 10 trials. The response of a wild type Wistar rat retinal ganglion cell to a biphasic current pulse recorded with a VLARS MEA. The pulse started at time point “0” (black triangle). The perievent histrogram (lower trace) summarizes the results of the corresponding perievent raster (upper traces). The neural response could be detected immediately after stimulation. Bin size 5 ms.
