
Figure 13.
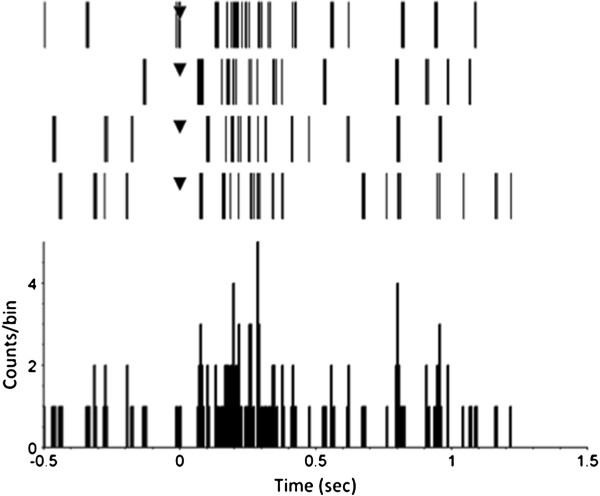
Perievent raster with histogram of four trials. The response of a wild type Wistar rat retinal ganglion cell to a one second white light flash recorded with a VLARS MEA. The illumination started at time point “0” (black triangle). The graph shows spontaneous activity 500 ms before stimulus onset, the response during the one second light stimulus and the activity 500 ms after illumination. Bin size 5 ms.