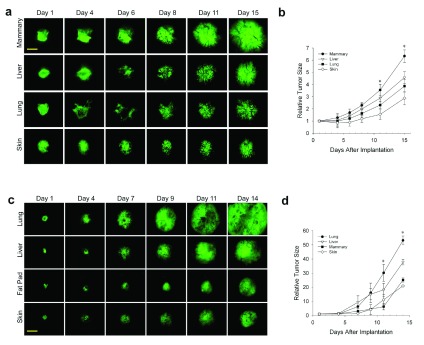
Figure 1. Effect of tissue microenvironment on tumor growth and development.
( a– d) N202 ( a and b) and LLC ( c and d) tumor spheroids expressing H2B-GFP were implanted directly onto the dorsal skin or with mammary, liver or lung tissue as indicated and monitored through the dorsal skin window chamber by IVM at the indicated times. ( b and d) Relative tumor fluorescence signal was measured by total GFP intensity relative to day 1. Scale bar = 500 μm Mean +/- SD are shown. * = p<0.05. n=3–4 mice for all experiments.

