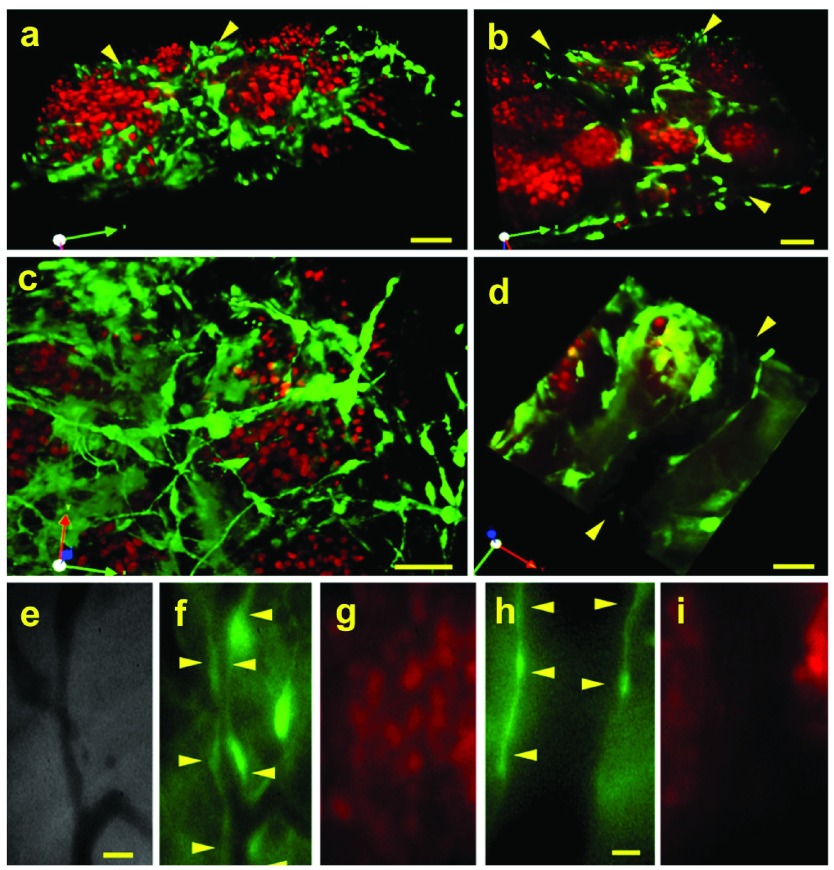
Figure 2. Distinct fluorescence imaging of tumor cells, tissue stroma and vasculature.
N202 H2B-mCherry mammary tumor spheroids (red) were implanted with mammary tissue excised from a lactating GFP mouse (green) or from a mouse expressing GFP under the EC-specific TEK promoter (TEK-GFP). 20 days post-implantation, 3D confocal fluorescent microscopic images were constructed ( a–d: GFP, h and i: TEK-GFP) as well as direct IVM fluorescent microscopic images (e-g: GFP) of the tumor and tissue stroma. Blood vessels are indicated by arrowheads. Scale bars = 10 μm ( a–d), 20 μm ( e–g), 5 μm ( h and i).

