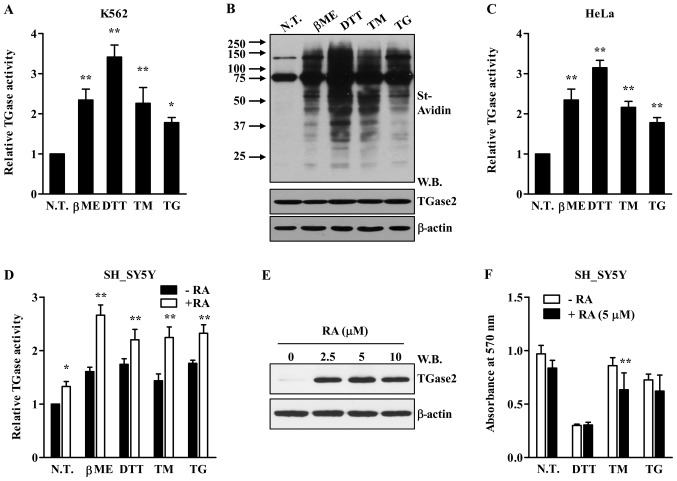
Figure 5.
ER stress activates TGase2 in various cell types. (A–D) In situ TGase2 activity in the indicated cell lines exposed to β-ME (7.5 mM) or DTT (3 mM) for 4 h and TG (1 mM) or TM (5 μg/ml) for 24 h. Relative TGase2 activity is expressed as the fold-change compared to values for non-treated cells, presented as means ± SD (n=3). **p<0.01 compared to N.T. (E and F) Western blot analysis of TGase2 (E) and cell viability (F) of SH-SY5Y cells following treatment with retinoic acid (RA). Reduction of the MTT reagent was quantified by measuring the absorbance at 570 nm. **p<0.01 compared to cells in the absence of RA (two-way ANOVA with Bonferroni post-test). N.T., not treated; β-ME, β-mercaptoethanol; DTT, dithiothreitol; TM, tunicamycin; TG, thapsigargin; St-Avidin, HRP-conjugated streptavidin; W.B., western blot.

