
Figure 3.
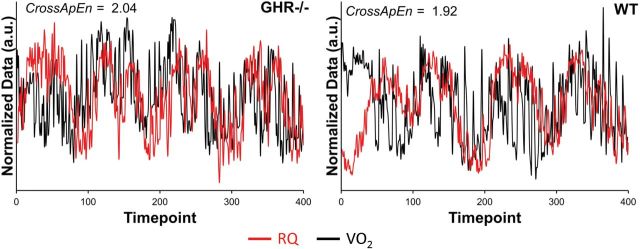
Exemplar unit variance normalized VO2–respiratory quotient (RQ) plots obtained from a single mouse from each group as an illustration of the differences in synchrony between the GHR− /− and wild-type (WT) mice. Visually, the WT data (left panel) exhibit clear areas of overlap and a general synchrony in their fluctuations. The GHR− /− fluctuations are not only more unpredictable but also have fewer regions where the data overlap. Furthermore, it is clear that the two variables seem to fluctuate more independently of one another. Data are presented in arbitrary units (a.u.) due to unit variance normalization to place both data sets on the same scale.