
Figure 3.
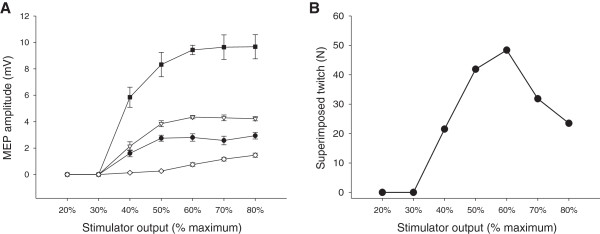
Sample stimulus–response curves. Stimulus–response curves at 50% maximal voluntary force for one subject for vastus lateralis (●), rectus femoris (∇), vastus medialis (■) and biceps femoris (◊) in Panel A and superimposed twitch in Panel B. All values are presented as means ± standard deviation (Panel A) or means (Panel B) of four evoked responses at each stimulus intensity.