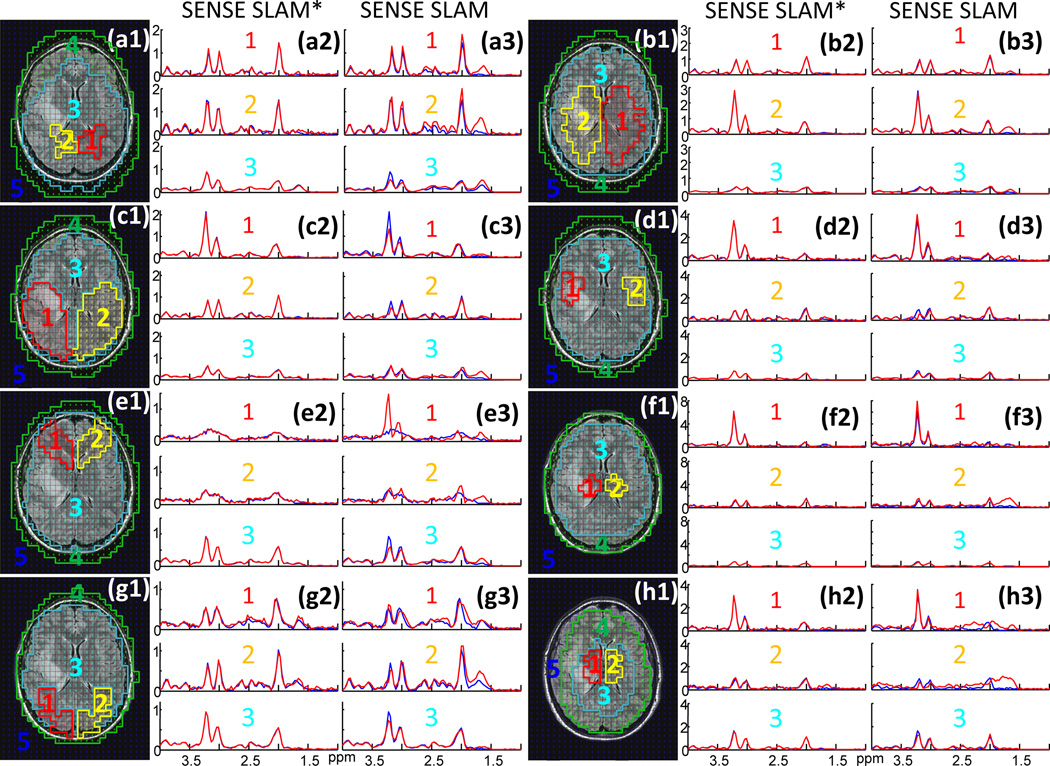
Figure 12.
The effects of incorrect segmentation and inhomogeneity. (a1–h1) Brain MRI showing eight grossly maladjusted segmentations (Fig. 8a shows the correct segmentation). The corresponding SENSE SLAM* (a2–h2, red) and SENSE SLAM spectra (a3–h3, red) reconstructed from the maladjusted compartments are compared with the average SENSE CSI cspectra (blue) from the same compartments. For SENSE SLAM* and SENSE SLAM, R = 5 compared to SENSE CSI.

