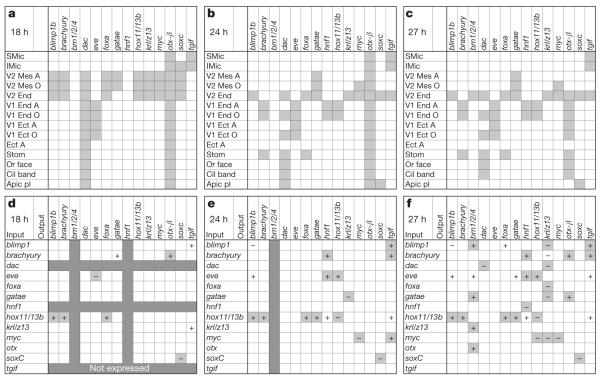
Figure 1. Endodermal gene expression and perturbation matrix.
a–c, Spatial expression (grey cells) of 14 endodermal regulatory genes at three time points post-fertilization. A, aboral; Apic pl, apical plate; Cil band, ciliated band; Ect, ectoderm; End, endoderm; LMic, large micromeres; Mes, mesoderm; O, oral; Or face, oral face; SMic, small micromeres; Stom, stomodeum; V1, veg1; V2, veg2. d–f Interactions among regulatory genes at three time points post-fertilization (data from ref. 17 and Supplementary Fig. 5). The change in output-gene expression after injection of a morpholino oligonucleotide targeting the input gene is denoted ‘−’ if expression is significantly increased (that is, the input gene represses the output gene) and ‘+’ if expression is significantly decreased (the input gene activates the output gene). Changes incorporated as regulatory linkages in the endoderm GRN are indicated by light grey cells (Supplementary Table 1); white cells with ‘+’ or ‘−’ denote significant effects that are not considered to be direct (Supplementary Tables 2 and 3); dark grey cells denote genes that are not expressed at the time point shown.

