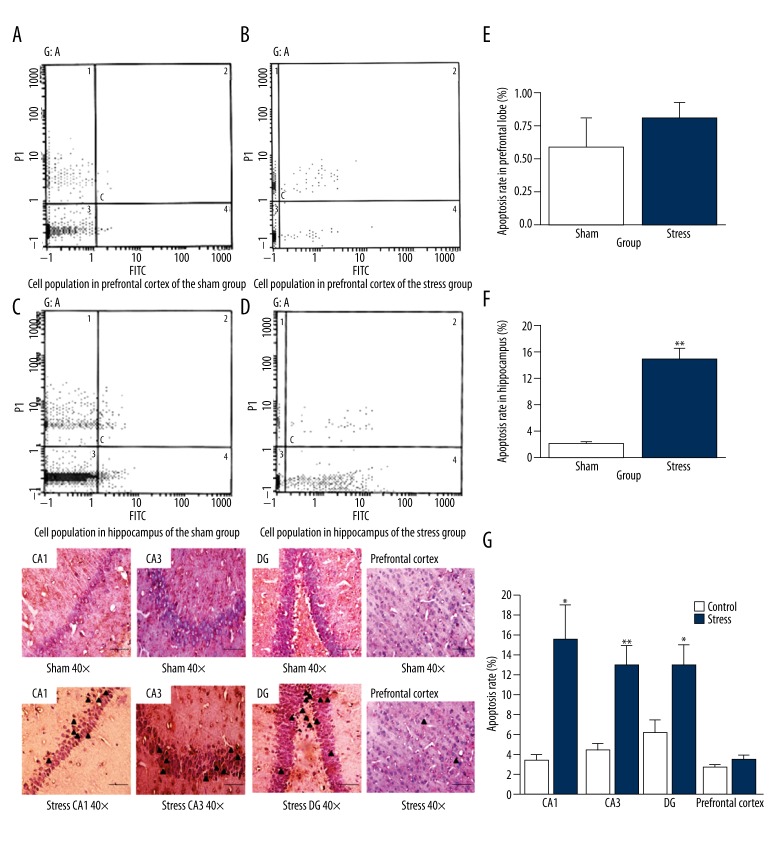
Figure 8.
Analysis of the apoptotic rate in prefrontal cortex and hippocampus by flow cytometry and TUNEL after stress. Flow cytometry pictographs: viable cell population (Annexin V−/PI−) is in region 3; early apoptotic cell population (Annexin V+/PI−) is in region 4; late apoptotic and necrotic cell populations (Annexin V+/PI+) are in region 2; and necrotic cell population (Annexin V−/PI+) is in region 1. (A) Cell population in the prefrontal cortex of sham group. (B) Cell population in the prefrontal cortex of stress group. (C) Cell population in the hippocampus of sham group. (D) Cell population in the hippocampus of stress group. (E) Comparison of the apoptotic rate in prefrontal cortex between stress and sham groups (* p<0.05 compared with the sham group). (F) Comparison of the apoptotic rate in the hippocampus between stress and sham groups (n=7 per group, * p<0.05). (G) Photomicrograph of neuronal apoptotic cells (TUNEL-positive cells) in the hippocampus (CA1, CA3, DG) and prefrontal cortex between stress and sham groups (see triangles) (n=6 per group, * p<0.05, ** p<0.01). The results are expressed as mean ±SEM. (Bar size 200 μm, magnification ×400).

