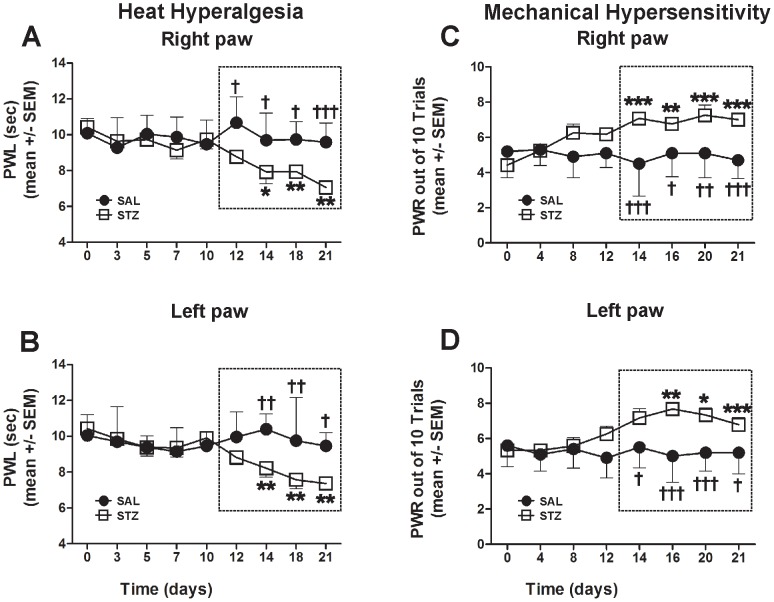
Figure 2. Diabetic rats develop significant heat hyperalgesia (A, C) and mechanical hypersensitivity (B, D).
PWLs and PWRs were recorded starting with assessment of the baseline before STZ administration (0 day) followed by periodical assessment for the next 21 days (A, Right paw, B, Left paw). Although a decline in PWL was noted first on day 12, it did not reach significance until day 14 when it approached a steady state (marked with dashed rectangle) of heat hyperalgesia as compared with the baseline recordings (*, p<0.05; **, p<0.01). The PWLs recorded in SAL animals revealed no change compared with the baseline but a significant change compared with those of STZ animals from day 12 (A) and day 14 (B) (†, p<0.05; ††, p<0.01; †††, p<0.001). Note similar latencies recorded in left and right paws indicating the systemic nature of the disease (A and B). The steady rise in PWRs indicative of mechanical hypersensitivity started on day 12; PWRs became significant from 14 days post-STZ treatment as compared with the baseline PWR recordings (*, p<0.05; **, p<0.01; ***, p<0.001). The PWRs recorded in SAL animals revealed no changes compared with the baseline but a significant change compared with STZ animals from day 14 (†, p<0.05; ††, p<0.01; †††, p<0.001; n = 5 STZ rats and n = 5 SAL rats per data point in A and B; n = 6 STZ rats and n = 5 SAL rats per data point in C and D).

