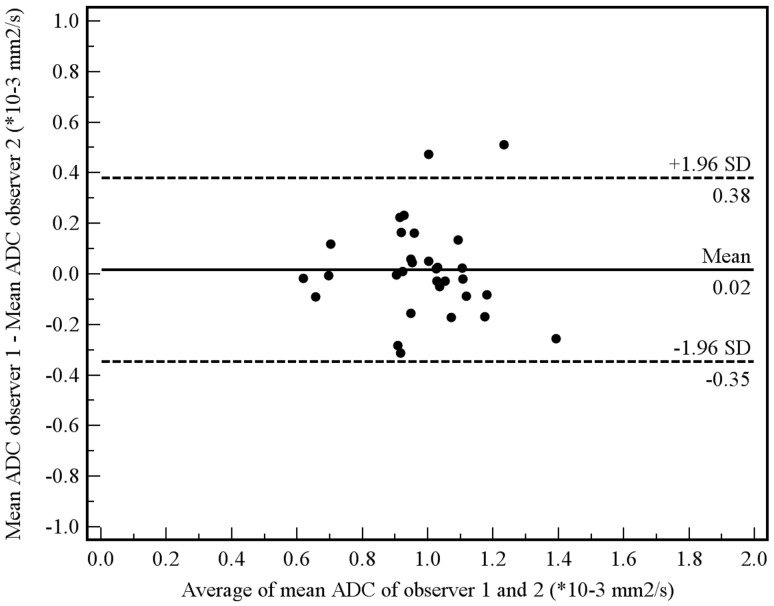
Figure 4. Interobserver reproducibility using the manual measurement method.
Measurements from both the first and second MRI scan were included in this analysis. Bland-Altman plot shows the difference between measurements of two observers (R.F.A.V. and S.S.) against the average measurement, with mean absolute difference (continuous line) and 95% CI of the mean difference (dashed lines).

