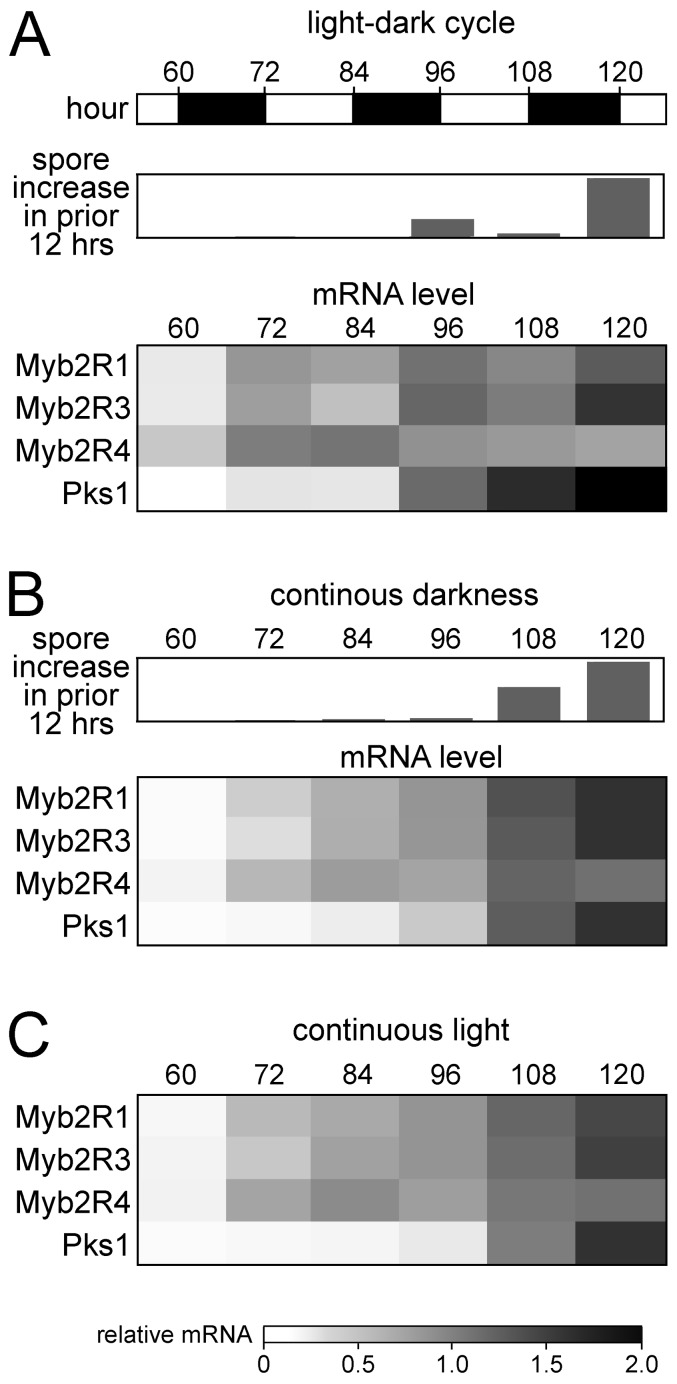
Figure 4. Sporulation and gene expression on rye-sucrose agar.
A, Cultures of strain 1306 exposed to a 12/12 hr dark cycle, showing the relative increase in sporangia and mRNA levels of four sporulation-associated genes. B, Cultures exposed to continuous darkness. C, Cultures exposed to continuous light. Gene expression and sporulation data are presented as in Fig. 3. Numerical RT-qPCR data are shown in Table S3.

