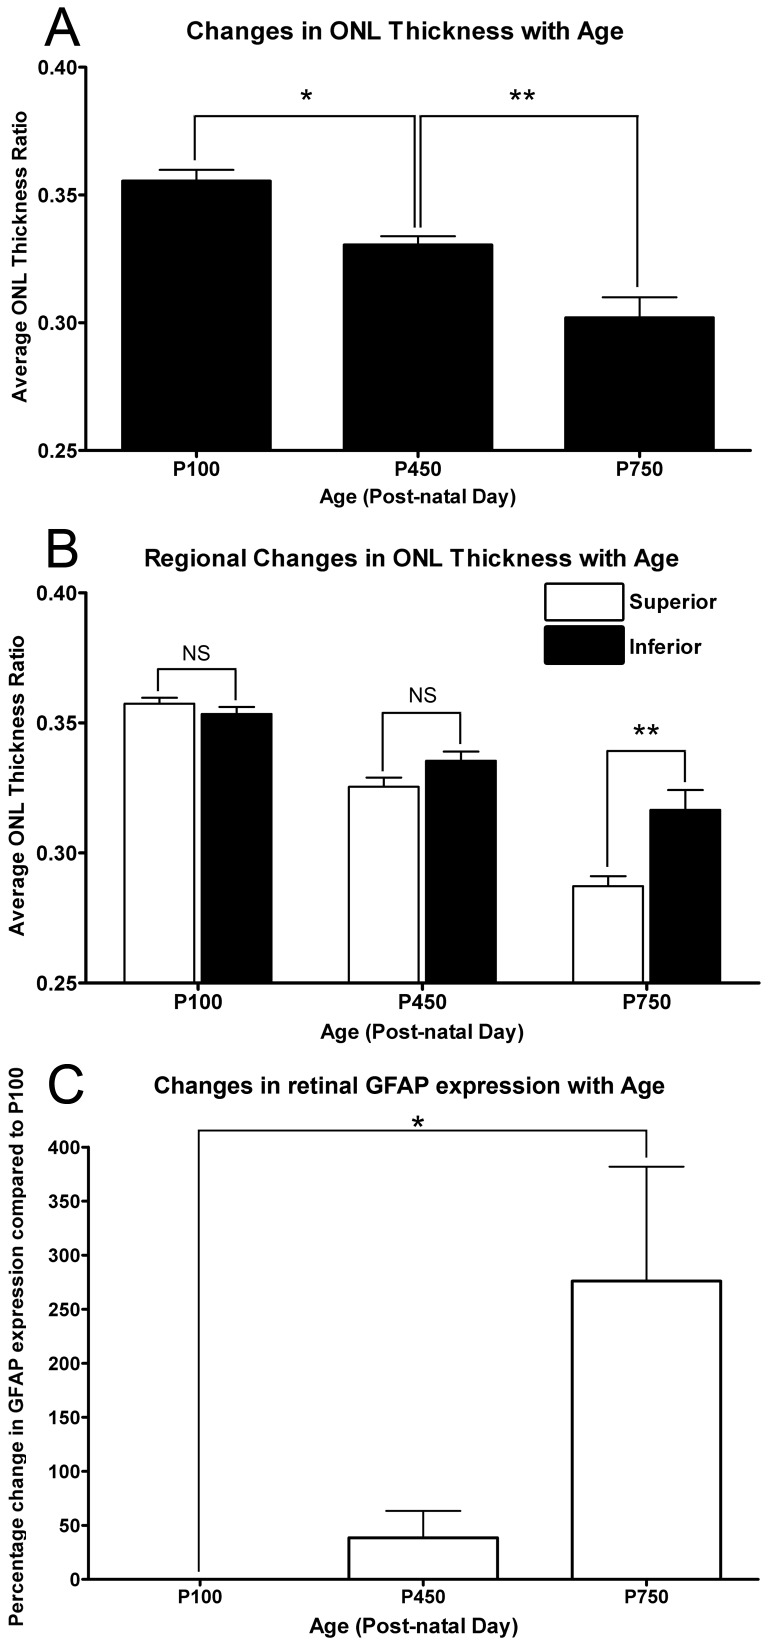
Figure 1. Quantification of ONL thickness and GFAP expression with respect to age.
A: The thickness of the ONL decreased progressively throughout the aging time course, and was markedly reduced by P750 (P<0.05). B: Regional variation in ONL thickness was not observed at P100 and P450 age-groups across the vertical meridian (P>0.05). At P750, the greater thinning was observed in the superior retina than the inferior (<0.05). C: The expression of GFAP was found to increase at P450, however this was not significant compared to P100 (P>0.05). At P750 a 276% increase was observed in the expression of GFAP, compared to P100 (P<0.05). P100 n = 3, P450 n = 3, P750 n = 3; error bars represent SEM. ‘*’ denotes a significant change using ANOVA with Tukey’s post-test where P<0.05, ‘**’ denotes P<0.01.

