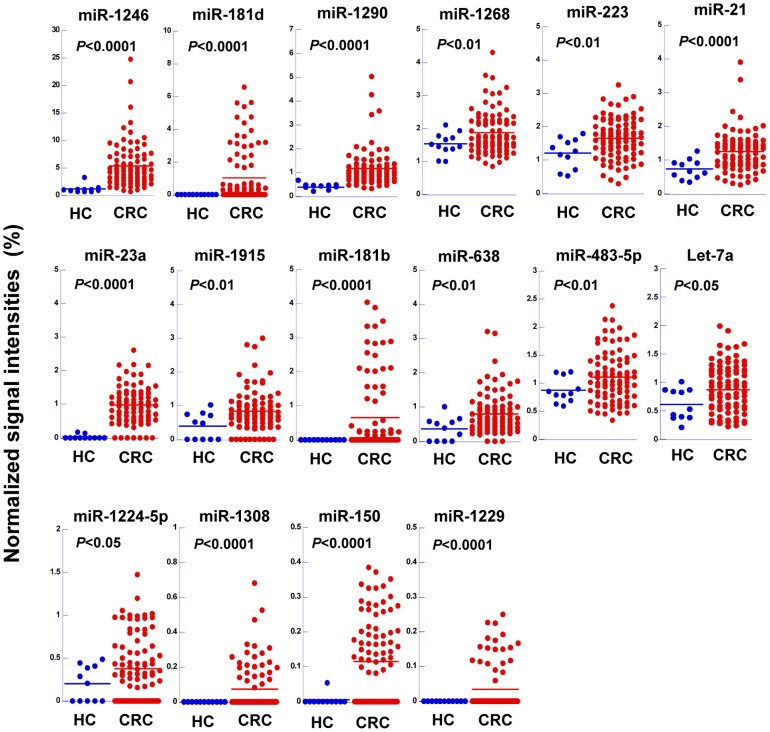
Figure 2. Serum exosomal expression levels of 16 miRNAs that were up-regulated in colon cancer.
Serum exosomal miRNA levels in 11 HCs (blue) and 88 CRC patients (red) at different TNM stages (I to IV). The signal intensities were normalized to the total signal intensity of the microarray. The horizontal lines indicate the mean normalized signal intensity for each group. Statistically significant differences were determined by Welch's t-test.

