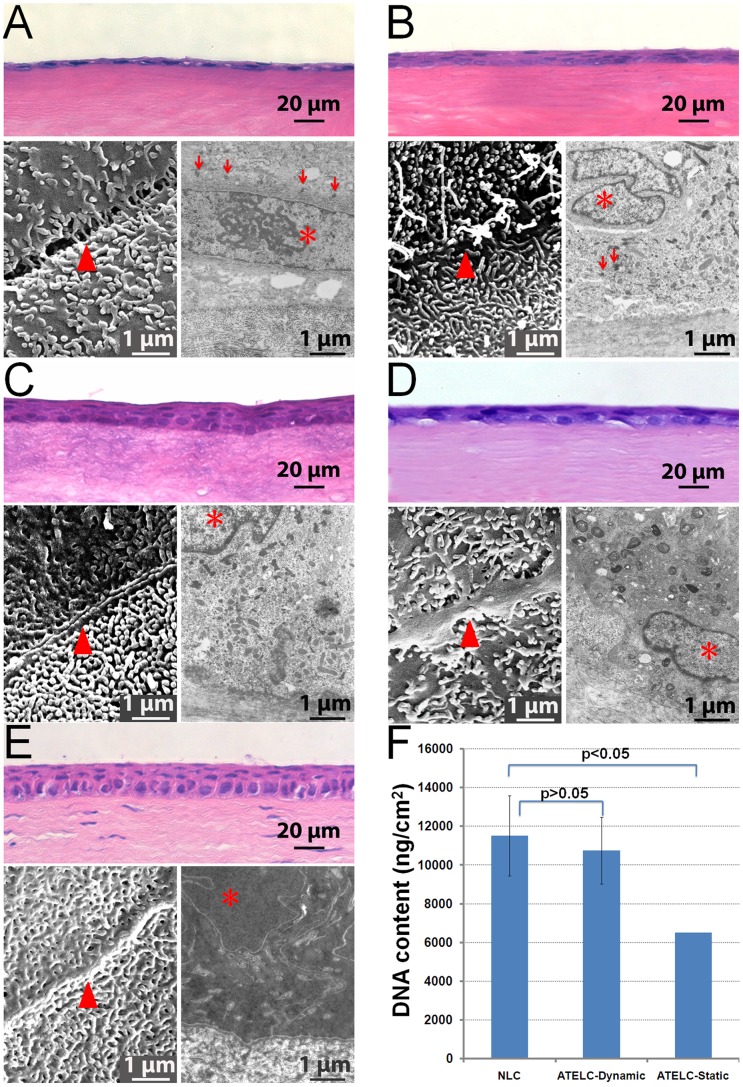
Figure 3. The changes in histomorphology and DNA content during the construction process (▴: connection between neighbor cells, *: cellular nucleus,↓: desmosome).
(A) ATELC-Dynamic, after submersion culture. (B) ATELC-Dynamic, after perfusion culture. (C) ATELC-Dynamic, after dynamic air-liquid interface culture. (D) Negative control: ATELC-Static. (E) Positive control: NLC. (F) DNA contents of the NLC, ATELC-Dynamic, and ATELC-Static groups.

