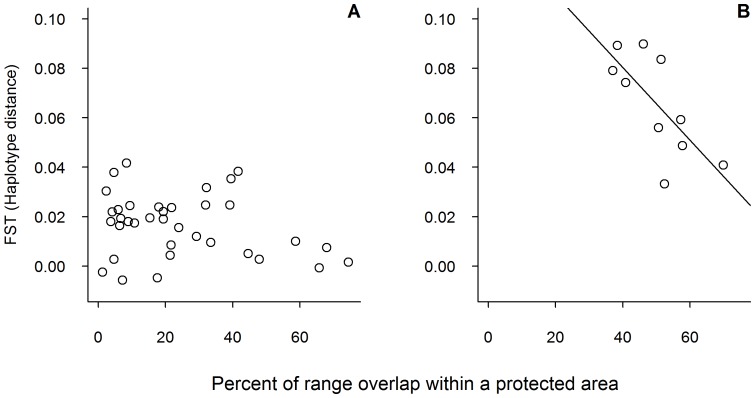
Figure 2. E. coli genetic distance as a function of range overlap between elephant families.
(A) Depicts data from Amboseli and (B) depicts data from Samburu. The relationship between percent overlap and FST was statistically significant in Samburu, but not Amboseli. Plots are for visualization purposes only; statistical analyses were performed using Mantel tests (see text for details). Analyses include data from adult female and juvenile elephants only.

