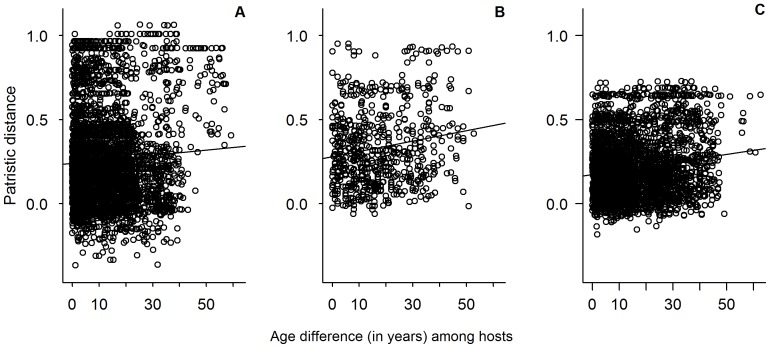
Figure 3. E. coli genetic distance as a function of age-difference among hosts.
(A) Depicts the relationship between age similarity and E. coli genetic similarity as measured by patristic distance for pairs of elephants from Amboseli; (B) depicts these relationships for pairs of elephants from Samburu; (C) depicts these relationships for pairs of elephants where one member was drawn from each population. Plots are for visualization purposes only; statistical analyses were performed using Mantel tests (see text for details).

