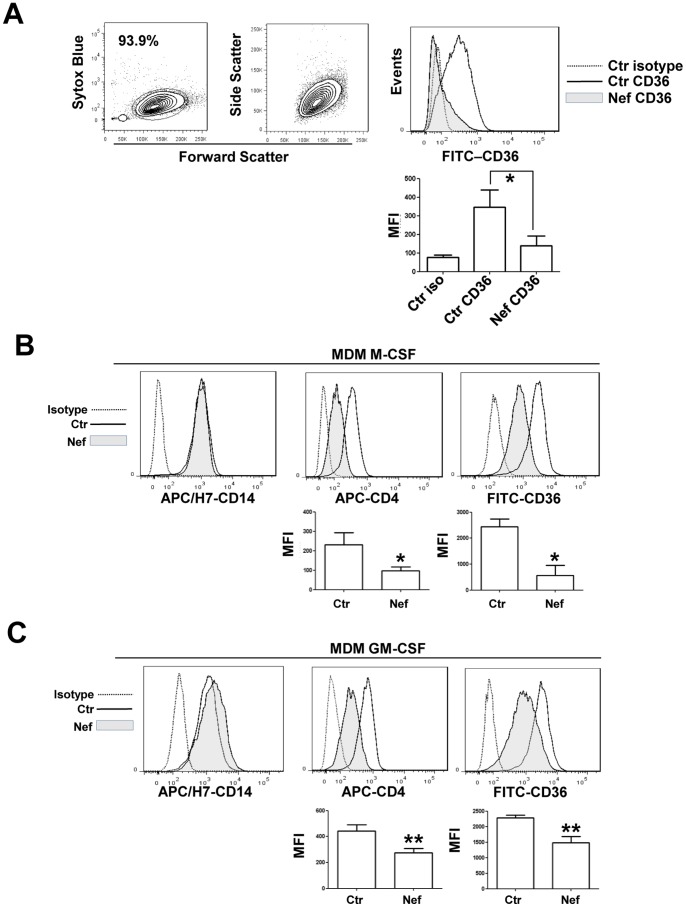
Figure 1. Nef induces downregulation of CD36 expression in human PBMC-derived monocytes.
Purified monocytes evaluated for CD14 expression (data not shown) were cultured in presence 50 ng/mL of rNef/myr for three days. (A) Representative dot plots and histogram of monocytes analyzed by flow cytometry. The dot plot on the center shows the forward and side scatter of monocytes. On the left is shown the viability of cells by using SYTOX Blue dead cell stain. CD36 expression, shown in the histogram, was analyzed by using FITC-conjugated anti-CD36 antibody and the fluorescence intensity in Nef-treated (solid grey histogram) was compared to untreated (solid line) cells. Matched isotype (dotted line) was used as control of non-specific fluorescence signals. (A, below the histogram) The column bar graph represents the MFI of cells stained with matched isotype control (Ctr iso), cells stained with FITC-conjugated anti-CD36 antibody (Ctr CD36), and Nef-treated cells stained with FITC-conjugated anti-CD36 antibody (Nef CD36). The results (mean ± standard deviation) are representative of five independent experiments (*p<0.05). In B and C representative histograms of M-CSF and GM-CSF differentiated MDMs evaluated for CD14, CD4 and CD36 expression are shown. Cells were isolated by using CD14 magnetic beads (Miltenyi Biotec) and cultured in presence of human M-CSF (10 ng/mL) or GM-CSF (50 ng/mL) for 5 days before adding rNef/myr protein. CD14, CD4 and CD36 expression was analyzed by using appropriate fluorochrome-conjugated antibodies and the fluorescence intensities in Nef-treated (solid grey histogram) were compared to untreated (solid line) cells. Matched isotype (dotted line) was used as control of non-specific fluorescence signals. (B and C, below the histograms) The column bar graphs show the MFI of untreated cells (Ctr) and Nef-treated cells (Nef) stained with APC- and FITC-conjugated anti-CD4 and CD36 antibodies, respectively. SYTOX Blue has been used to exclude dead cells from the analyses. The results (mean ± standard deviation) are representative of four (MDM M-CSF) and six (MDM GM-CSF) independent experiments (*p<0.05, (**p<0.01).

