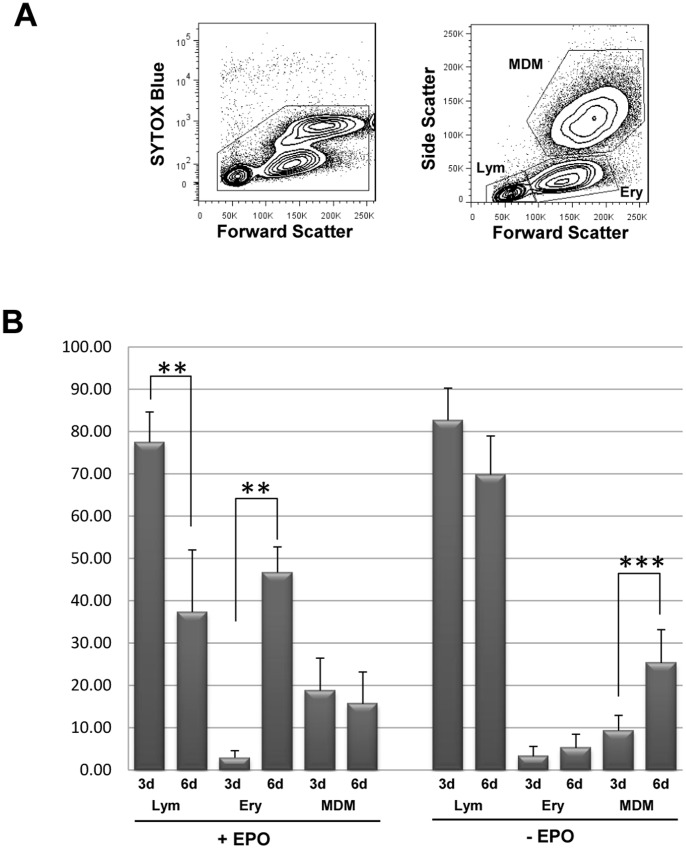
Figure 2. PBMCs cultivated under HEMA cell culture conditions produce three main populations.
PBMCs were cultivated in HEMA condition (see Materials and Methods) for three and six days. (A) Representative dot plots PBMCs analyzed at six days in HEMA condition by flow cytometry. The dot plot on the left shows the viability of cells by using SYTOX Blue dead cell stain. The dot plot on the right shows the three main populations identified by characteristic forward and side scatter: a lymphocyte gate (Lym), erythroblast gate (Ery) and MDMs. (B) PBMCs have been cultivated in HEMA culture condition in presence or absence of EPO. The relative percentages of the three populations (Lym, Ery, MDMs) at three (3d) and six (6d) days in HEMA (+/− EPO) culture are presented in the histogram. The results (mean ± standard deviation) are representative of six (HEMA condition) and twelve (HEMA w/o EPO condition) independent experiments (**p<0.01, ***p<0.005).

