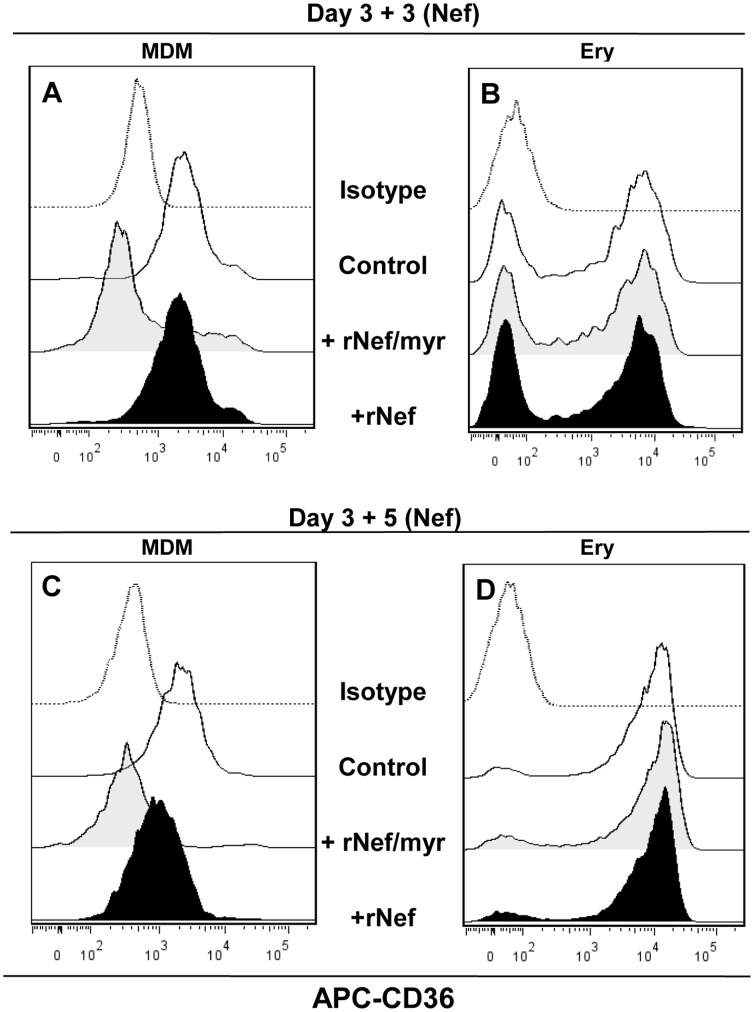
Figure 5. Comparison of myristoylated and non-myristoylated Nef activity on CD36 expressed by MDM and erythroblast cells cultivated in HEMA condition.
PBMCs were cultivated in HEMA condition for three days followed by additional three or five days in presence of 50/mL rNef/myr and rNef. Representative histogram of MDM (A) and Ery (B) cells analyzed by flow cytometry for the expression of CD36 after three days of Nef treatment while in (C) and (D) MDM and Ery cells analyzed after five days of Nef treatment are shown. The fluorescence intensities were compared to untreated cells (Ctr). In all experiments matched isotypes (Isotype) were used as control of non-specific fluorescence signals. SYTOX Blue was used to exclude dead cells. The results are representative of three independent experiments.

