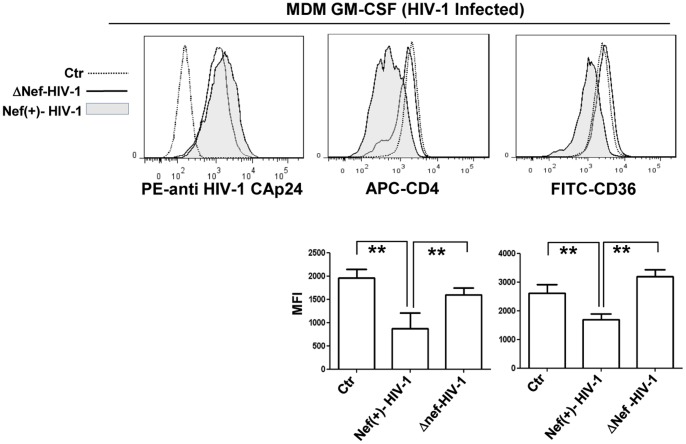
Figure 6. CD36 and CD4 expression in MDM GM-CSF cells infected in vitro with Nef(+)-HIV-1.
MDMs differentiated in presence of GM-CSF for 5 days were infected with VSV-G pseudotyped HIV-1-expressing (Nef (+)-HIV-1) or not expressing the nef gene (ΔNef-HIV-1). In the left histogram the infection efficiency is shown; it is evaluated by estimating the levels of intracytoplasmic HIV-1 Gag-related products (HIV-1 CAp24) by flow cytometry analysis at 48 h postinfection. CD4 and CD36 expression was analyzed by using APC- and FICT-conjugated antibodies (center and right histogram, respectively) and the fluorescence intensities in Nef(+)-HIV-1-infected (solid grey histogram) was compared to ΔNef-HIV-1-infected (solid line) cells. Matched isotype (dotted line) was used as control of non-specific fluorescence signals. The column bar graphs, below the respective histograms, represent: the MFI of untreated cells (Ctr), and Nef(+)-HIV-1- and ΔNef-HIV-1-infected cells stained with APC-conjugated anti-CD4 and FITC-conjugated CD36 antibodies. SYTOX Blue has been used to exclude dead cells from the analyses. The results (mean ± standard deviation) are representative of four (MDM M-CSF) and six (MDM GM-CSF) independent experiments (**p<0.01).

