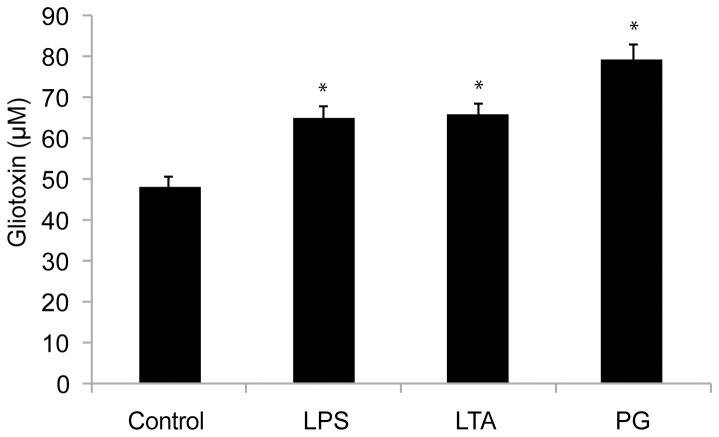
Figure 4. The gliotoxin concentration in the growth media of the four subgroups with 40 cultures each and their standard errors of mean.
The Mann-Whitney test indicated that the reference group had a significantly (P<0.001) lower gliotoxin concentration than the other three, indicated by (*), which were grown in the presence of 5 μg of LPS, LTS or PG per ml.

