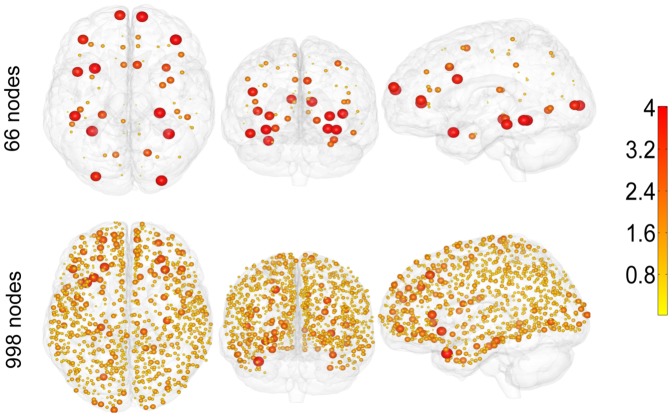
Figure 3. Localization of areas which are bottlenecks of information.
The value of r for each region for the Ising model on brain networks, for the 66-nodes connectome (top) and the 998 nodes one (bottom). The size of the spheres is proportional to r, thus showing the most prone regions to became bottlenecks of information.

