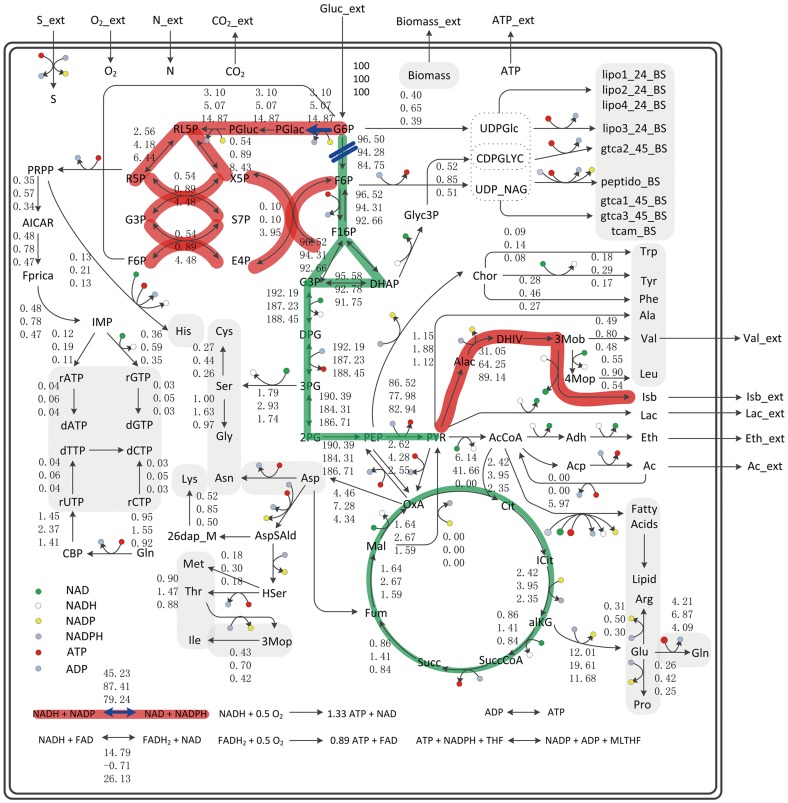
Figure 1. The metabolic flux distribution in isobutanol-producing strain B. subtilis.
Data represented in silico flux distribution of different isobutanol-producing strains (top BSUL03, middle BSUL04, down BSUL05). Bold red and green lines represented the increased and decreased flux, respectively. The blue marks represented the targets for redox pathway engineering in this work. Abbreviations were listed in previous work [10]. Part of the flux data in central metabolism were taken from previous work [10].

