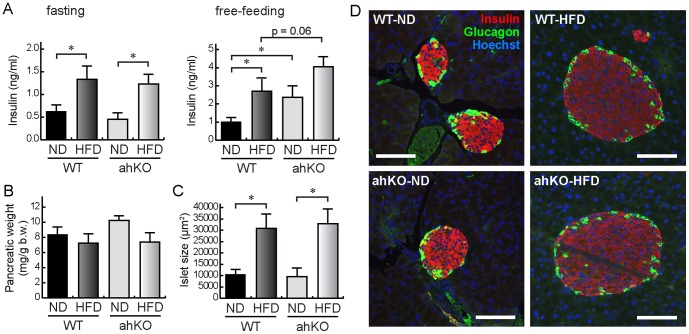
Figure 4. Serum insulin concentrations and pancreatic characteristics of ahKO mice.
(A) Serum insulin levels under free-feeding and fasting conditions. Values are means ±S.E.M. (n = 6). *P<0.01. (B) Pancreatic weights. Values are means ±S.E.M. (n = 6). (C) Sizes of pancreatic islets. Values are means ±S.E.M. (n = 6). *P<0.01. (D) Immunostaining images of pancreatic islets. Immunostaining was performed with anti-insulin (red) and anti-glucagon (green) antibodies. Nuclei were counterstained with Hoechst (blue). Bars indicate 100 μm.

