Figure 5.
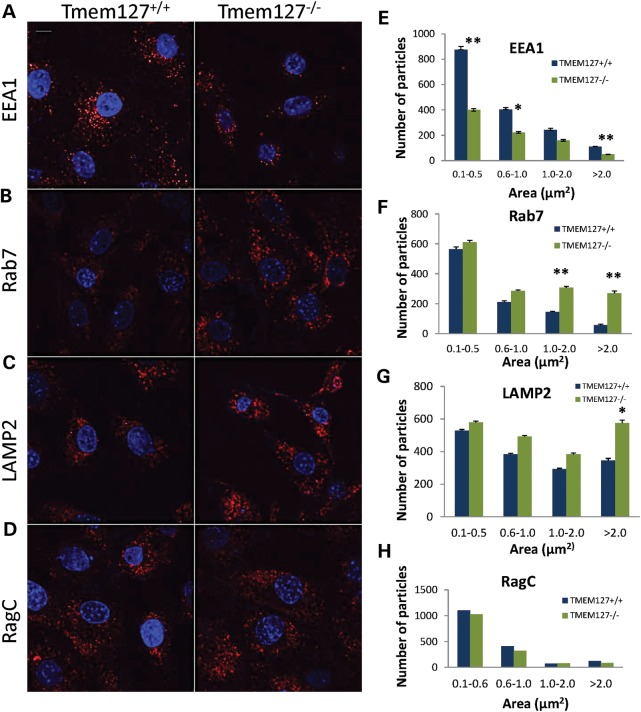
Differential staining of endogenous endosomal markers in Tmem127 null MEFs. Confocal microscopy of Tmem127+/+ or Tmem127−/− MEFs stained with EEA1 (A), Rab7 (B), LAMP2 (C) and RagC (D) is shown in red. Nuclei are stained with DAPI (blue). Scale bars are 10 µm. (E–H) Quantification of puncta of the indicated size ranges for each endosomal marker from 20 to 40 cells analyzed from two to four independent experiments per marker is shown as indicated. Data are plotted as mean ± SEM (*P < 0.05, **P < 0.01).

