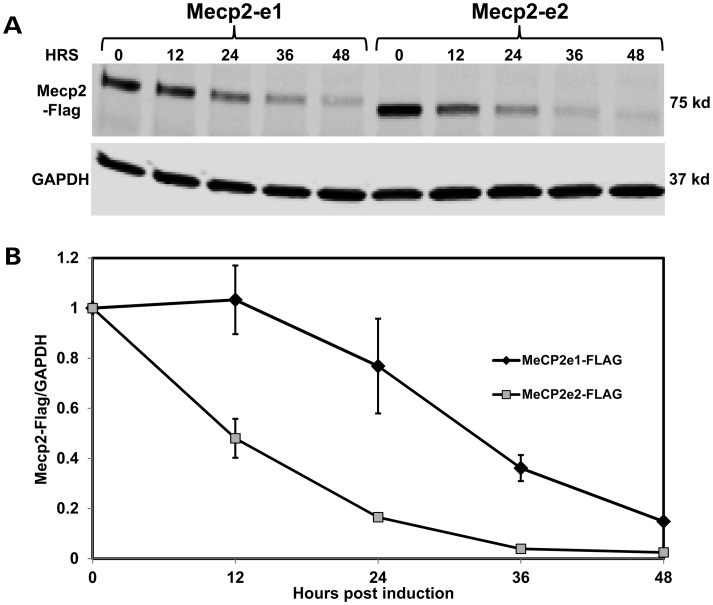
Figure 8.
MeCP2-e1 is more stable than MeCP2-e2 in neurons. (A) Western blot analysis of flag-tagged MeCP2-e1 and MeCP2-e2 isoform abundance following shutdown of protein expression with doxycycline treatment shown as hours (HRS). Western blot analysis of GAPDH is shown below for normalization. (B) The ratio of MeCP2-e1 (black line) and MeCP2-e2 (gray line) compared with GAPDH remaining after expression shutdown is graphed with error bars corresponding to standard error of the mean (SEM).

