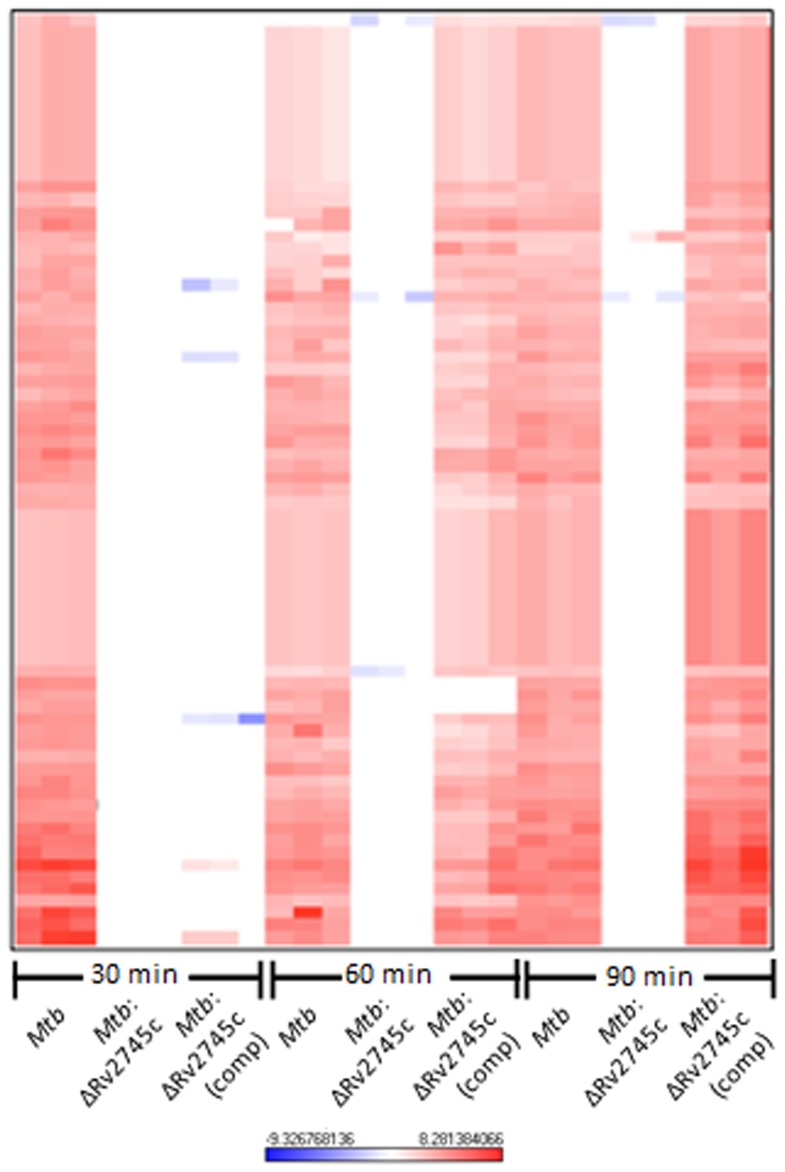
Figure 3. Diamide Induced Genes.
The heat map show results of unsupervised hierarchical clustering focusing on the genes with the highest magnitude of change. A majority of genes induced by diamide treatment in Mtb are also induced in Mtb:ΔRv2745c (comp) by 60 minutes and not induced in Mtb:ΔRv2745c. Genes that are induced in Mtb are also induced in Mtb:ΔRv2745c (comp), whereas there is no change in expression levels in the isogenic mutant indicating that Rv2745c plays a the redox response. n = 3. Red color indicates induction while blue color indicates repression, relative to the control channel. The intensity of each color corresponds to the magnitude.

