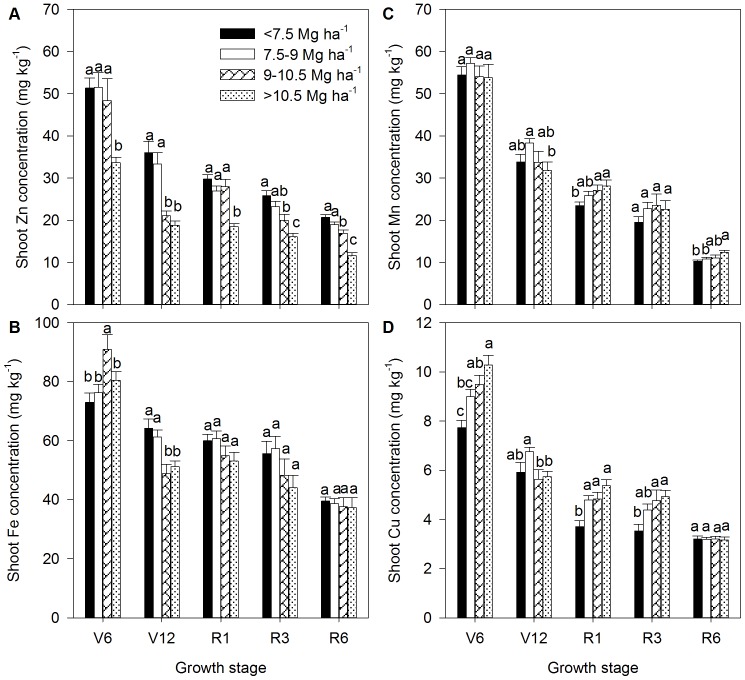
Figure 3. Dynamics of shoot Zn concentration (A) shoot Fe concentration (B), shoot Mn concentration (C) and shoot Cu concentration (D) of summer maize at V6 (six-leaf stage), V12 (12-leaf stage), R1 (silk emerging), R3 (milk stage) and R6 (physiological maturity) stages, respectively, with different grain yield ranges.
The number of observations was shown in Table S2.The bars represent the standard error of the mean. Bars with different lowercase letters are significantly different at different yield ranges (P<0.05).

