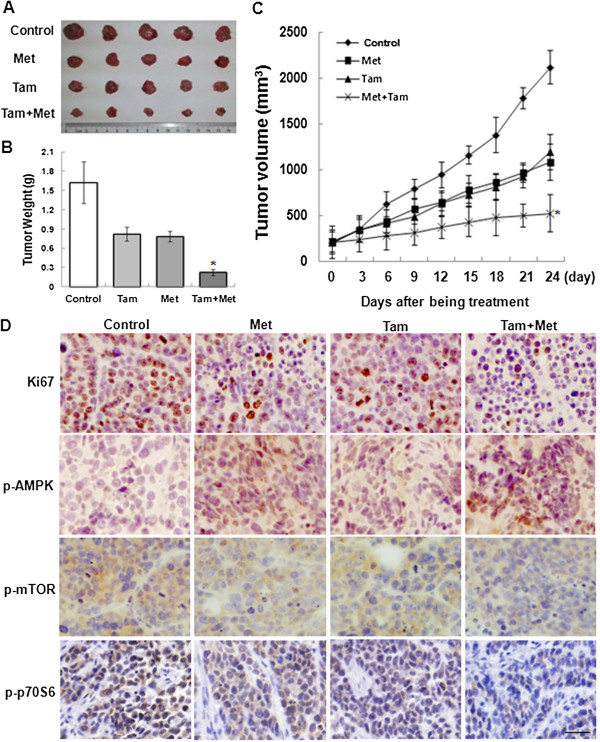
Figure 6.
Inhibitory effects of metformin and tamoxifen on tumor growth in a nude mouse model. These experiments were performed as described in the “Methods”. When the tumors in nude mice reached 200 mm3, the mice were given metformin (2 mg/ml) in their drinking water, tamoxifen (60 mg/kg) through oral gavage or the two agents simultaneously. The tumor growth was assessed every 3 days until day 24 of treatment by measuring two perpendicular diameters and calculating the volume in mm3. (A) Photographs of typical tumors are shown. (B) Histograms represent the weight of tumors from the different groups. (C) Tumor growth curve. Statistical analysis was performed using one-way ANOVA and Student’s t-test day with the day 24 values only. *P < 0.05 compared with the Tam group. (D) Intratumoral target protein expression was assessed by Ki67, p-AMPK, p-mTOR and p-p70S6 immunolabeling on paraffin-embedded tumor sections. Representative images are shown (original magnification, 400x).

