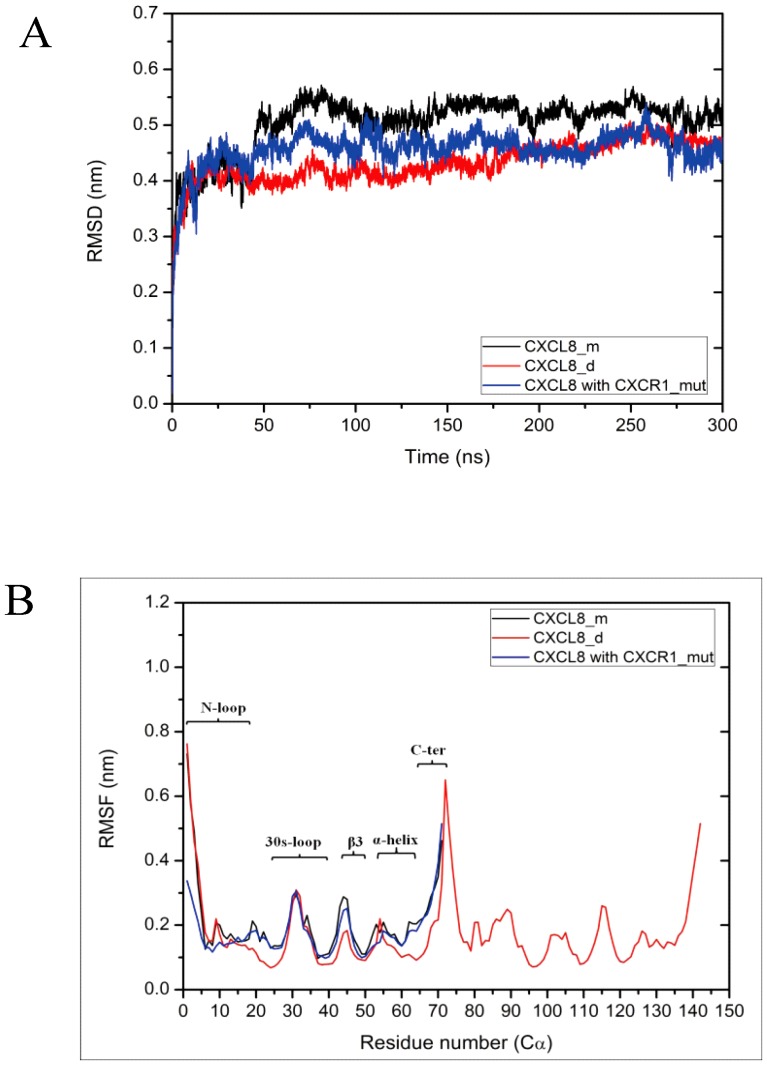
Figure 2. RMSD and RMSF values of CXCL-8 at various ligands binding systems during MD simulations.
Calculated average RMSD of three replicates for backbone of ligands (A) as well as the average RMSF of three replicates for each residue of ligands (B) at various ligand binding receptor systems throughout the 300 ns MD simulations. Error bars of the curves are omitted for figure clarity. The locations of the N-loop, 30s-loop, β3, α-helix, and C-terminus are marked in the figure. All types of values are shown for monomeric CXCL-8 in black, dimeric CXCL-8 in red and mutated receptor CXCR1_mut (R199A, R203A, and D265A of CXCR1) in blue, respectively.

