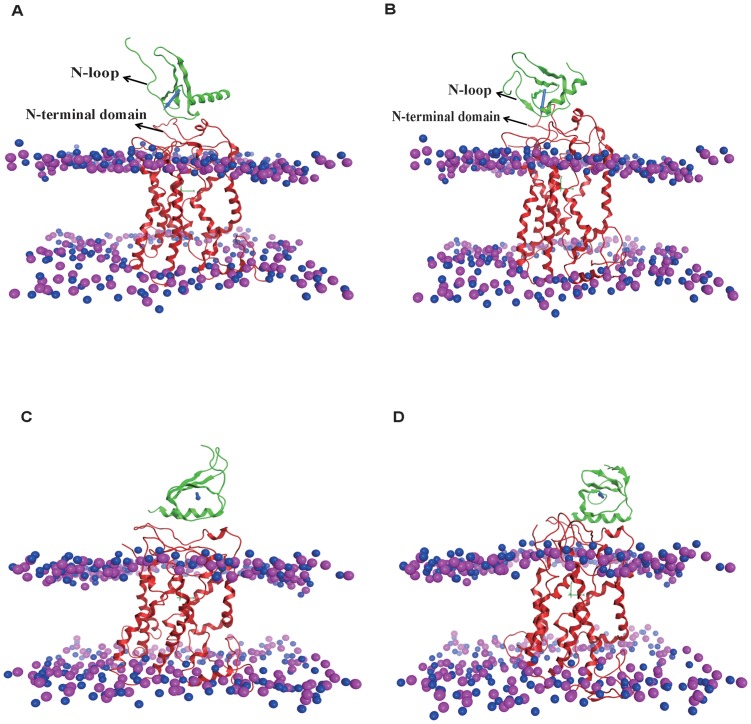
Figure 3. The binding orientation of ligand for various systems at different MD simulation time.
Due to the similar final binding orientations of the three replicates of each system and the figure clarity, only one representative simulation run of each system is shown herein. (A) and (B): For monomeric CXCL-8 system at initial and final simulation time; (C) and (D): For mutated receptor CXCR1_mut system at initial and final simulation time. In all figures, ligands are colored with green, receptors are colored with red, and phosphorous and nitrogen atoms are colored with pink and blue, respectively. The direction of dipole moment of ligand is represented as blue arrow. The distance between the two layers is represented as the thickness of the membrane.

