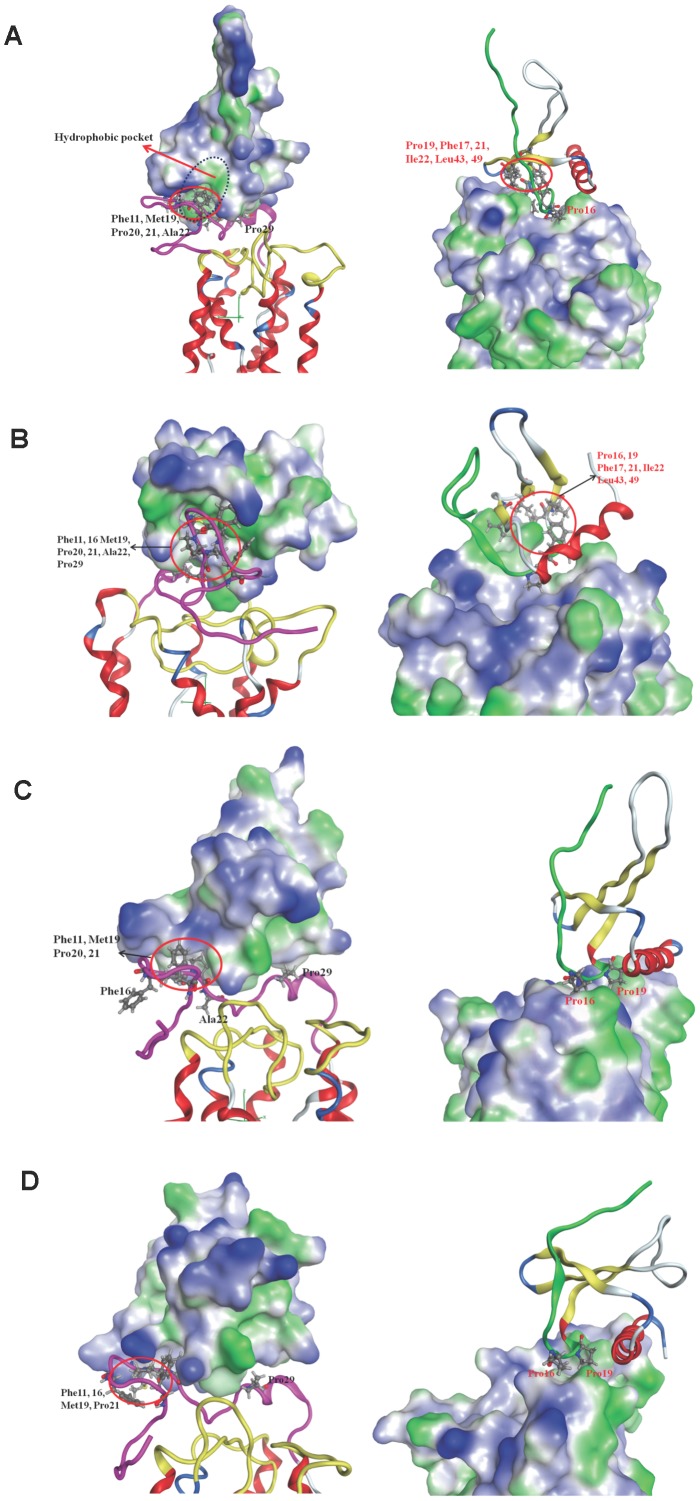
Figure 6. The surface lipophilicity distribution for ligand binding with receptor.
The complex structure is represented as ribbon structure with the N-loop of the ligand colored green, the N-terminus of receptor colored pink, and the EC-loops colored yellow. Blue color represents the hydrophilic part while green color represents hydrophobic part. Residues around the binding interface are labeled and shown as sticks; black font is for receptor, while red font is for ligand. (A): Monomeric CXCL-8 binding with CXCR1 at the initial time. Hydrophobic pocket of ligand CXCL-8 is also marked. (B): Monomeric CXCL-8 binding with CXCR1 at the final simulation time. (C): CXCL-8 binding with CXCR1_mut at the initial time. (D): CXCL-8 binding with CXCR1_mut after the 300 ns runs.

