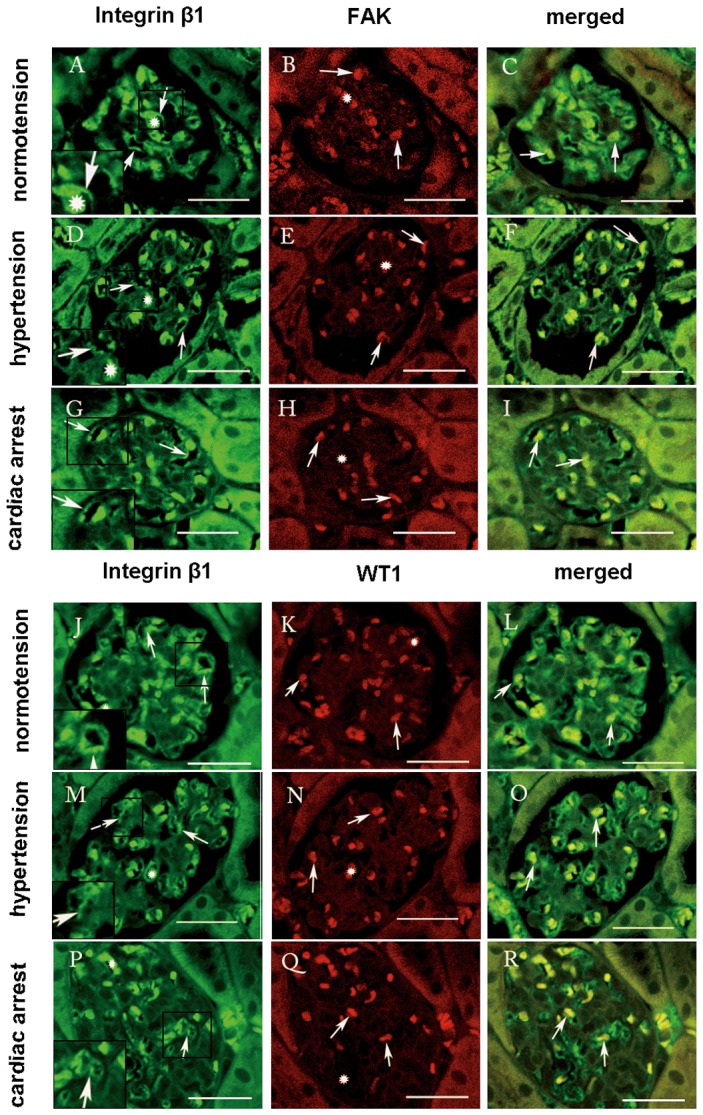
Figure 3. Confocal laser scanning micrographs show the double-fluorescence of integrin β1-FAK (A–I), and integrin β1-WT1 (J–R).

Under normotensive condition, integrin β1 showed intense staining along the GBM of the glomeruli (A, arrows). FAK was distributed in the cytoplasm and nuclei of the podocytes evenly (B, arrows). WT1 was localized in the podocytes as well (K, arrows). Under acute hypertensive condition, the immunoreactivity of integrin β1 decreased and stained intermittently (D,arrows), while FAK was restricted to the nuclei of the podocytes (E, arrows), and both of FAK and WT1 decreased. Under the cardiac arrest condition, the immunoreactivity of integrin β1 with FAK and WT1 was obviously reduced (I, R, arrows), compared with the normotensive condition. The double-staining micrographs are shown in C, F, and I (integrin β1 and FAK, arrows), and in L, O, and R (integrin β1 and WT1, arrows). Both of them were distributed in erythrocytes (asterisk). Left bottom pictures are the manified micrographs. Scale bars = 20 μm.
