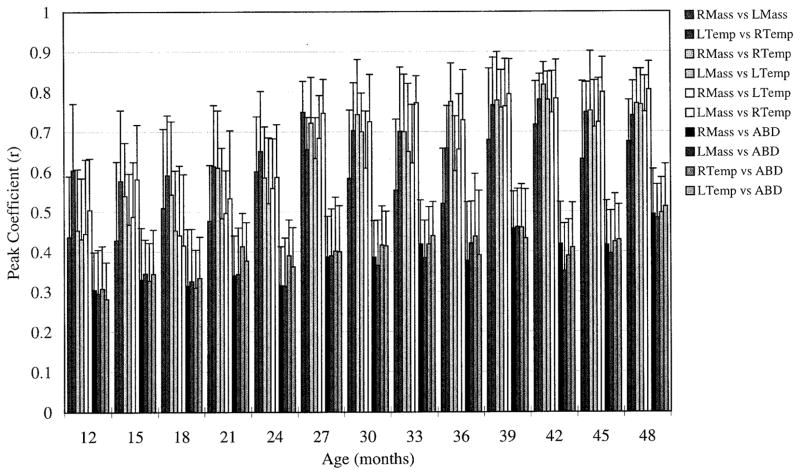
FIG. 5.
Vertical bars: peak coefficients obtained from pairwise cross-correlations, averaged across all repetitions and all subjects. Error bars: average within-subject SD. For each age, from left to right, 1st 6 bars represent synergistic muscle pairs; the last 4 bars represent antagonistic pairs. Greater values were interpreted as representing increases in coupling of activation. Increases in coupling were observed in both synergistic and antagonistic muscles pairs.

