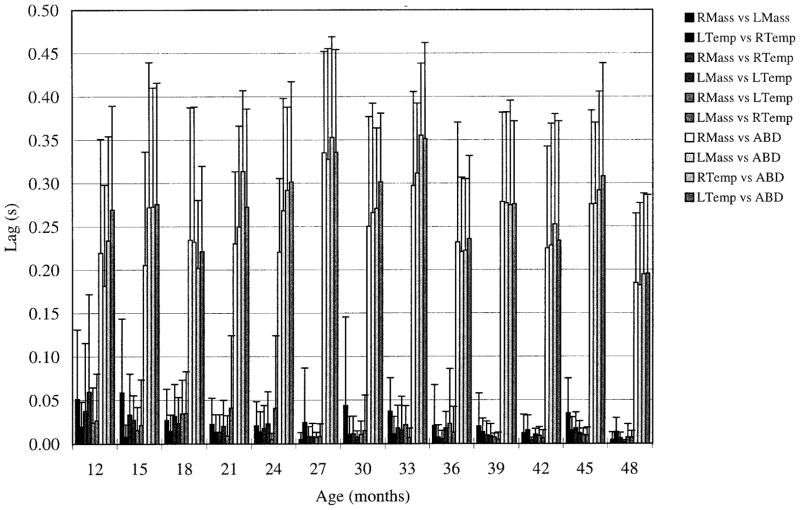
FIG. 6.
Vertical bar height corresponds to absolute lag value averaged across all repetitions and subjects for a given muscle pair. Error bars: average within-subject SD. For each age, from left to right, 1st 6 bars represent synergistic muscle pairs; the last 4 are antagonistic muscle pairs. Increase in synchrony among synergists with age was statistically significant.

